Hello,


I’m using the Statistical API and I’m interested in adding custom calculations. Specifically, I want to calculate the percentage of pixels within a polygon where the NDVI (Normalized Difference Vegetation Index) value is higher than 0.8, or falls within a specific range. Is there a way to achieve this using the Statistical API?


Below is my script for reference. Thank you!


//VERSION=3

function setup() {
return {
input: u
{
bands: d
"B04",
"B08",
"dataMask"
]
}
],
output: u
{
id: "ndvi",
bands: 1
},
{
id: "ndviMask",
bands: 1
},
{
id: "dataMask",
bands: 1
}
]
};
}

function evaluatePixel(samples) {
let NDVI = index(samples.B08, samples.B04);
let NDVI_R = (NDVI > 0.40 && NDVI < 0.8) ? 1 : 0;

return {
ndvi: vNDVI],
ndviMask: s NDVI_R ],
dataMask: ssamples.dataMask]
};
}


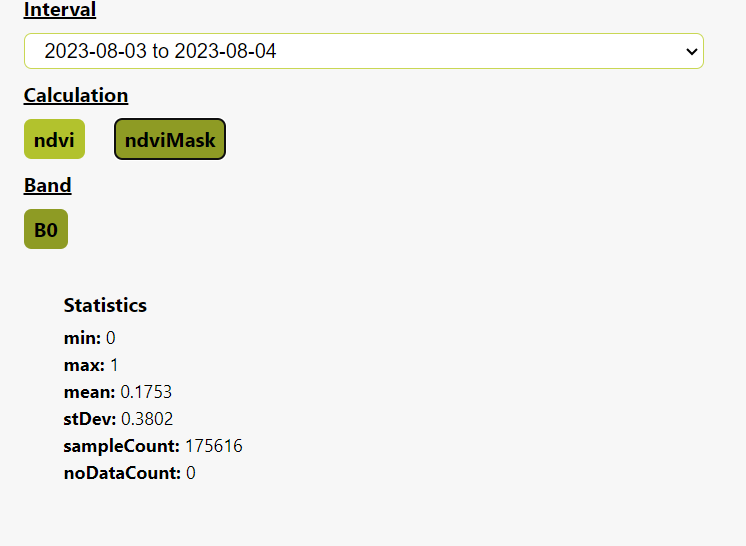
The result appears something like this.

I believe that using the histogram functionality should give you the results you are looking for. Check out this bit of documentation here, and there is a great example here too. In the example, it shows you how to set custom bin widths for your histogram and the output also includes a count of the pixels in that bin.


Hi ,

In addition to the histogram feature, you can also initialise a variable and assign it to 1 if ndvi value meets your condition else 0. Just like how you did for NDVI_R. In this case the mean will be the percentage of pixels within your aoi that meets the condition. Below is an example:

//VERSION=3

function setup() {
return {
input: [
{
bands: [
"B04",
"B08",
"dataMask"
]
}
],
output: [
{
id: "ndvi_gte_0_8",
bands: 1
},
{
id: "ndvi_r",
bands: 1
},
{
id: "dataMask",
bands: 1
}
]
};
}

function evaluatePixel(samples) {
const NDVI = index(samples.B08, samples.B04);
let valid_ndvi = 0;
if (isFinite(NDVI)) {
valid_ndvi = 1;
}
const NDVI_gte_0_8 = (NDVI >= 0.8) ? 1 : 0;
const NDVI_R = (NDVI > 0.40 && NDVI < 0.8) ? 1 : 0;

return {
ndvi_gte_0_8: [NDVI_gte_0_8],
ndvi_r: [NDVI_R],
dataMask: [samples.dataMask * valid_ndvi]
};
}

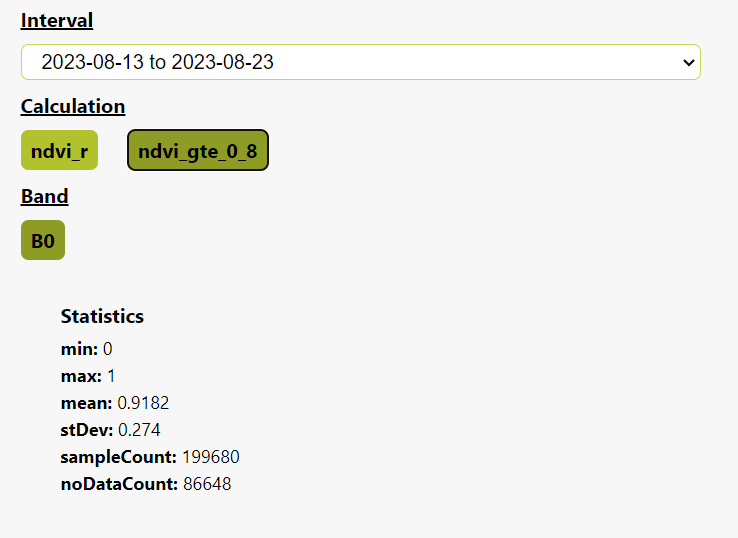
Thank you very much for your responses; I truly appreciate it. I’ve obtained the results I expected. I just have one more question: I’m a bit unclear about the logic behind this ‘mean value’ in relation to calculating a percentage.

thanks

Resultas:


Hi,

Since we assign 1 to pixels which meet the condition and 0 to pixels which don’t, you can imagine that we are counting the number of pixels meeting the condition when calculates the mean. In your case, we plus 1 when there’s a pixel greater than or equal to 0.8 and we plus 0 if the value is less than 0.8. At the end, by dividing the total number of pixels within the AOI, the mean value will be the percentage of pixels that meets the condition.


thank you for sharing this information; it has certainly clarified things for me.


Reply