Thanks in advance for any feedback.
Sentinel 1 acquisitions on the same track over the same area at successive times (12 days apart) the one swath is skewed. Seems as if the skewing started in July 2019 and ended by February 2020. After February 2020 the swaths went back to being rectangles like they were before July 2019.
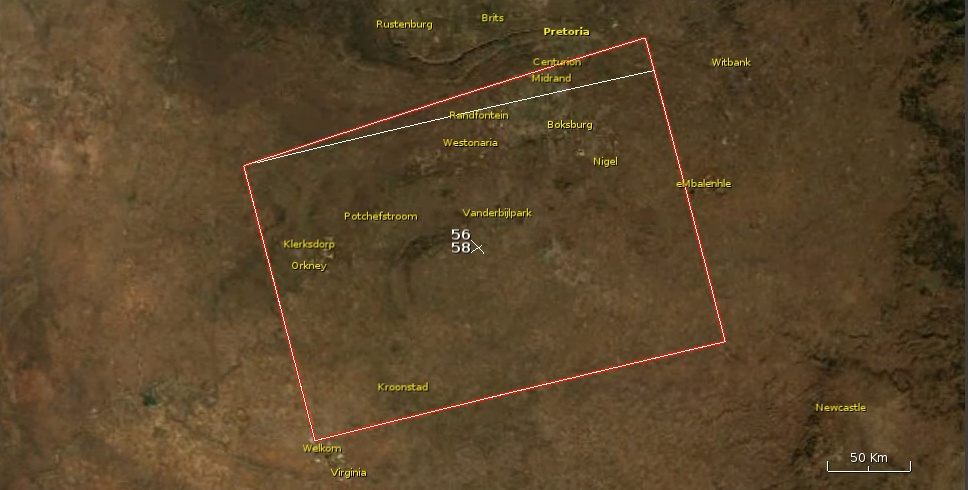
Swaths in image from snap:
S1A_IW_SLC__1SDV_20190625T164639_20190625T164706_027838_032491_C852
S1A_IW_SLC__1SDV_20190707T164640_20190707T164707_028013_0329E7_3559
I’m hoping someone can help me since this seems to be the cause of my time-series sub-regions being misaligned. Is this likely to happen or is this a problem with the meta-data in the acquistrions?