Hello,
I’m using the FIS in order to generate line chart of the mean NDVI value of a given polygon.
I have seen here that I can filter the clouds in the images by using this costum script:
//VERSION=3

function setup() {

  return {

    input: :"B04", "B08", "CLM"],

    output: { bands: 2 }

  };

}


function evaluatePixel(sample) {

  let ndvi = index(sample.B08, sample.B04);

  return nndvi, sample.CLM];

}
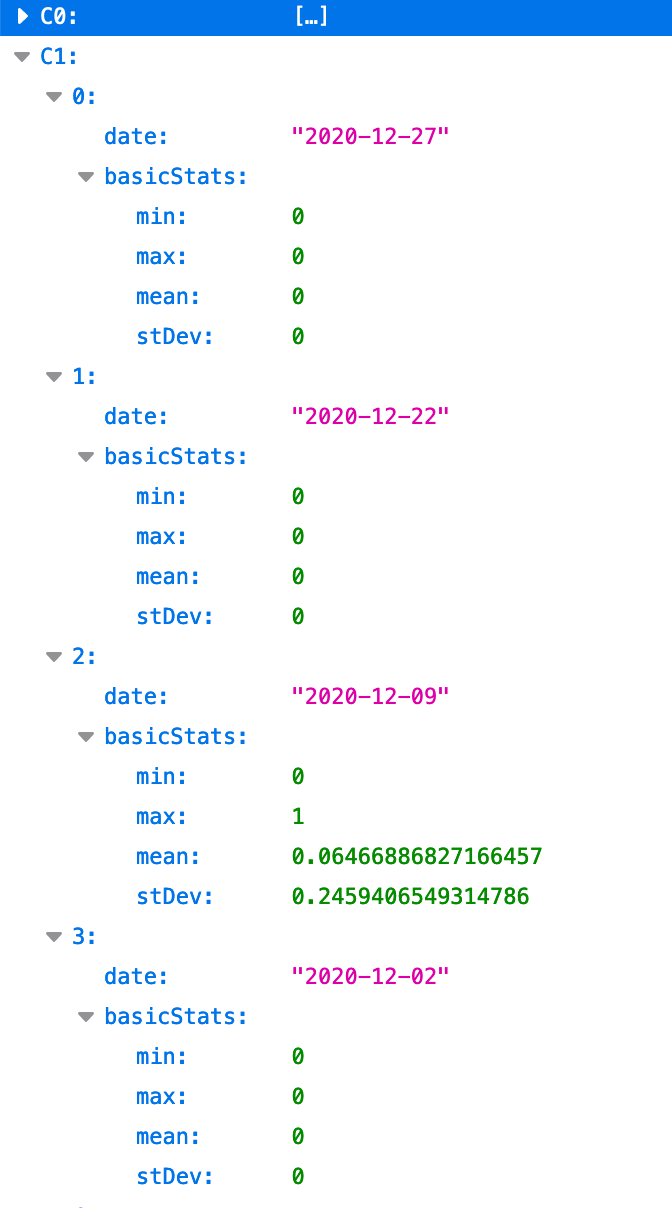
I have used this script in the configuration utility, but I don’t see big differnce in the line chart before and after the CLM added, and i’m afraid i’m not using it correct.
Is there any more stage to do beside have the CLM band in the costum script?
Do I need to do something in the FIS request so it knows to mask the clouds?
This is how I did the FIS request:
    fis_request = FisRequest(

    data_collection=DataCollection.SENTINEL2_L2A,

    layer='NDVI_VALUES',

    geometry_list=rpolygon],

    time=time_interval,

    resolution='10m',

    data_folder='./data2',

    config=config)


    fis_data = fis_request.get_data(save_data=True)

    df = fis_data_to_dataframe(fis_data)


    plt.figure(figsize=(10,6))

    df.plot(x='date',y='mean',title=x)

    plt.show()
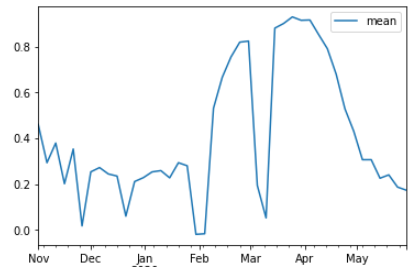
This is the graph I get:
I tend to believe that the result in March and February are clouds.
So I would like to know if there is any further step to do in order to apply the cloud mask.


