I ordered imagery for a large area and the result was several shots. Is it possible to symbolize them in such a way that they have the same color range?
Thank you,
Randy McGregor

 +1
+1I ordered imagery for a large area and the result was several shots. Is it possible to symbolize them in such a way that they have the same color range?
Thank you,
Randy McGregor
Best answer by joe.kington
@Randy McGregor - Visual will be less consistent than SR, generally speaking. The visual product for SkySat uses a different color scale for each collect (it’s histogram-based). However, SR will not be perfectly consistent between collects either.
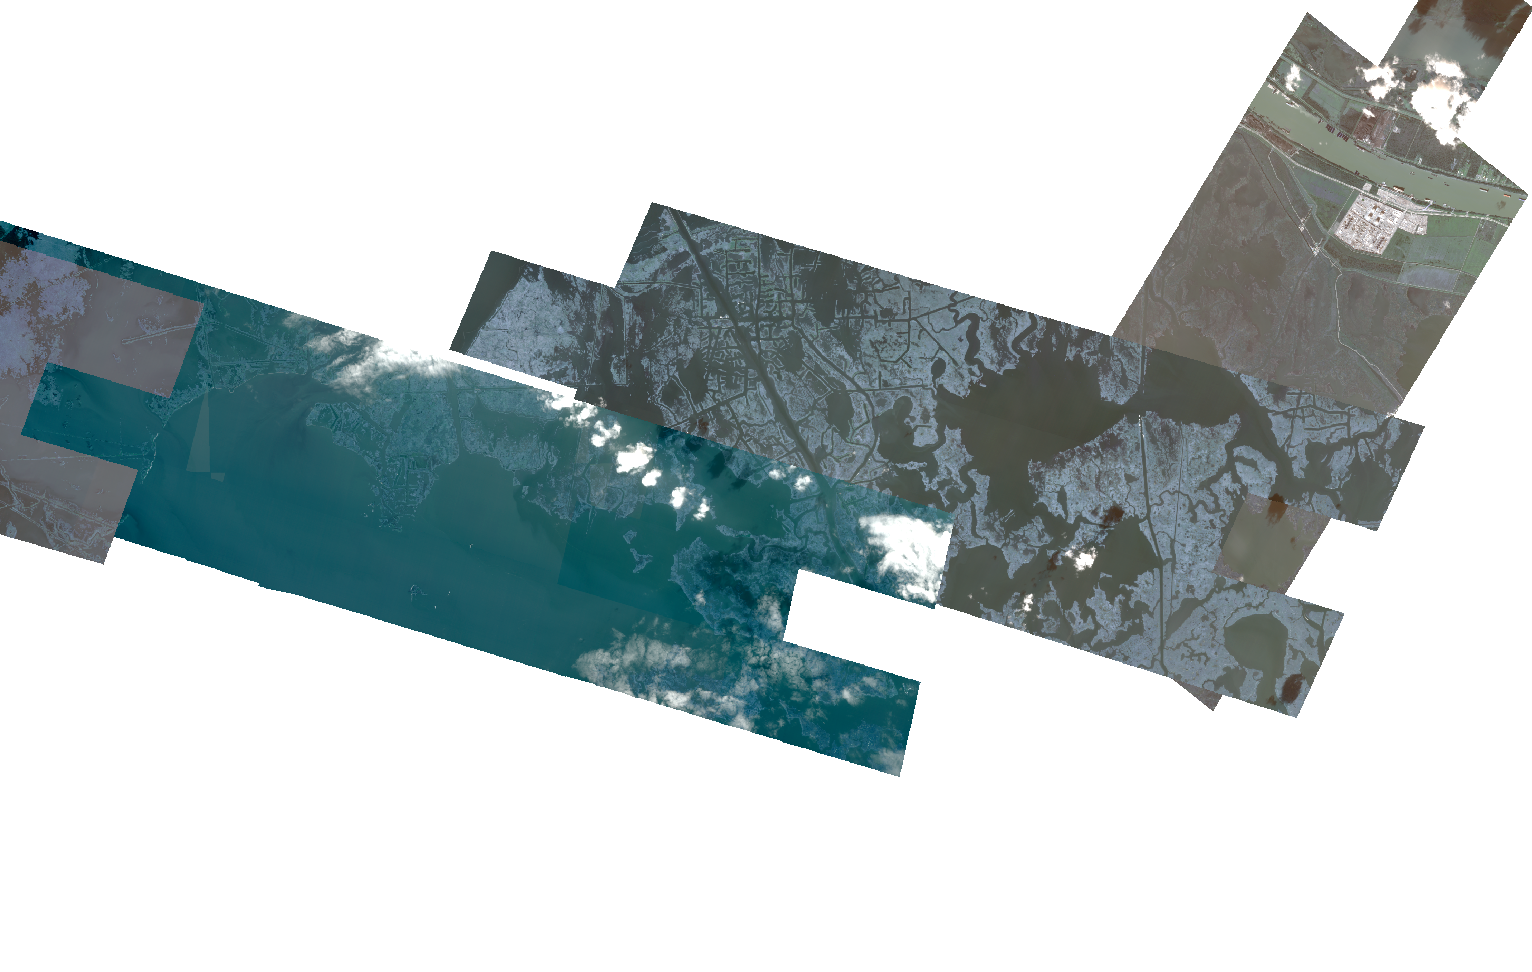
Most likely, what you’re seeing is differences due to default scaling for whatever GIS you’re using. Most GIS software will display every file with a different range unless configured not to. That’s because it defaults to scaling multi-band 16-bit data independently for each band based on percentiles, which are different for each file. It will also usually default to putting the first band in the blue channel, second in the green, and third in the red. For SkySat (and most other multispectral satellite imagery), this means that it’s displaying the blue band as red and the red band as blue, which explains the blue cast in your screenshot.
Try setting the symbology manually. Use a fixed range for each scene and _not_ an independent percentile or standard deviation for each band. A range of 0-3000 for an RGB view or 0-5000 for a false color infrared view should be a good starting point. You may want to adjust that if you're in a forested area (e.g. 0-2500 for RGB and 0-7000 for CIR).
Regardless of what you choose, be sure to set the symbology to use the same display range for each SR collect.
Ideally, you’d use a non-linear display curve to make a visual display from SR data. That would avoid the need to display different land cover types differently. It’s needed because our eyes don’t perceive intensity linearly. However, a linear scaling over the lower part of the reflectance range (0-3000 is 0.0 to 0.3 reflectance) mimics the first “steep” portion of a typical non-linear display curve. It’s a good first start and will give a reasonably realistic display.
Even once that’s done, however, you will still see differences between collects. Those differences will be due to radiometry differences and not arbitrary scaling differences, however. SR varies significantly with view angle (SkySat usually acquires off-nadir), time of day, solar angle, and many other factors. You’ll still see that variability, but at least you’ll be viewing fundamental radiometric differences and not differences due to the GIS display defaults.
No account yet? Create an account
Enter your E-mail address. We'll send you an e-mail with instructions to reset your password.
© 2026 Planet Labs PBC. All rights reserved.
| Privacy Policy | California Privacy Notice |California Do Not Sell
Your Privacy Choices | Cookie Notice | Terms of Use | Sitemap