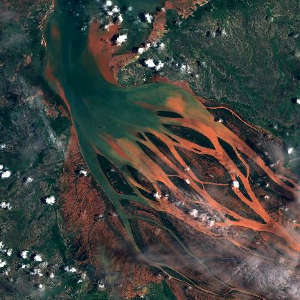
Yep, it is possible.
You have to engage the multi-temporal processing (mosaicking = ORBIT)
Here is an example
sentinelshare.page.link
Sentinel-2 L2A imagery taken on May 8, 2022
In order to configure the right colors, you might want to revise or replace this part:
return valueInterpolate(diff, [-1, 0, 1], [
[1, 0, 0],
[1, 1, 1],
[0, 1, 0]
]);
Thank you for your response.
I have a few questions about the script to be able to use it.
If I use it on another image it shows only white color,
and I don’t see the part in the script that defines the 2 dates being compared.
Thanks for any answer.
Not sure what you mean by “on another image”. It is important to have a time range, so that there is something to compare. In EO Browser there is a “timespan” button, where you need to set start and end time.
Here the difference is calculated:
var ndvi_last = calcNDVI(samples(0]);
var ndvi_first = calcNDVI(samples(samples.length - 1]);
var diff = ndvi_last - ndvi_first;
Oh, I see. I kinda made some visuals from that, but it highlights red not only decresed ndvi values, but all low ndvi values such as water, building etc… I don’t know how to make it work as I described.
Hi @MicroCzech ,
You could use SCL
band or create a self-defined mask for water or building.
Hello,
I still haven’t managed out how to edit that script to visualize only the 0,5-0,8 ndvi values (I’m interested only about trees). If it’s not a big deal, could you still help me with that?
Hi, if you could share the evalscript I can help you with your visualisation
Hello, thank you for your help.
I’m currently working with the script below that sent me Mr. Milcinski , but I can’t get the visualization I need. The script shows some changes in NDVI, but I’m only interested in tree values and only those that are decreasing. Practically I am trying to script showing this anomaly. But currently the script visualizes all surfaces in red and it’s hard to find the anomaly I need. Since healthy trees have an ndvi value higher than 0.8, I would like the script to show only the places with decline rate from this value.
Script:
//VERSION=3
//This script was converted from v1 to v3 using the converter API
function setup() {
return {
input: {
bands:
"B04",
"B08"
]
}],
output: {
bands: 3
},
mosaicking: "ORBIT"
}
}
function calcNDVI(sample) {
var denom = sample.B04+sample.B08;
return ((denom!=0) ? (sample.B08-sample.B04) / denom : 0.0);
}
function evaluatePixel(samples) {
var ndvi_last = calcNDVI(samples(0]);
var ndvi_first = calcNDVI(samples(samples.length - 1]);
var diff = ndvi_last - ndvi_first;
return valueInterpolate(diff, e-1, 0, 1],
b1, 0, 0],
b1, 1, 1],
b0, 1, 0]
]);
}
function filterScenes (scenes, inputMetadata) {
return scenes.filter(function (scene) {
return scene.date.getTime()>=(inputMetadata.to.getTime()-2*31*24*3600*1000) ;
});
}
Hi @MicroCzech ,
If I understand correctly, you would like to mask out pixels having an initial ndvi value lower than 0.8
. In this case you could create mask with the threshold you mentioned and put it to the forth band for transparency.
Here’s an example code:
//VERSION=3
function setup() {
return {
input: :{
bands: :
"B04",
"B08"
]
}],
output: {
bands: 4
},
mosaicking: "ORBIT"
}
}
function calcNDVI(sample) {
var denom = sample.B04+sample.B08;
return ((denom!=0) ? (sample.B08-sample.B04) / denom : 0.0);
}
function evaluatePixel(samples) {
var ndvi_last = calcNDVI(samplese0]);
var ndvi_first = calcNDVI(samplesesamples.length - 1]);
var diff = ndvi_last - ndvi_first;
var tree_mask = 1
if (ndvi_first < 0.8) {
tree_mask = 0;
}
var viz = valueInterpolate(diff, ,-1, 0, 1], ,
1, 0, 0],
1, 1, 1],
0, 1, 0]
]);
return nvizi0], vizi1], vizi2], tree_mask];