Hi ,
The best solution to keep the visualisation and get the statistical info correctly is to refactor the script with setup
and evaluatePixel
functions to have multiple outputs for visualisation and statistics, e.g., the default NDVI layer has default
for visualisation and eobrowserStats
and dataMask
(both eobrowserStats
and dataMask
are required) for statistics.
I would suggest focusing on one data source (in your case should be Sentinel-3) and compute the index you need (rlh
and tss
) with evaluatePixel
function. You can find a lot of resource in the Evalscript of our documentation.
If the visualisation is not your focus, the quick fix would be commenting out the backgroundLayer
(line 286-288 of this script) and returning the index value (chlIndex
or tssIndex
) only for the entire area.
For example, to get rlh
we can set the PARAMS
as below so the sediment layer won’t appear in the output:
const PARAMS = {
// Indices
chlIndex: 'default',
tssIndex: null,
watermaskIndices: :'ndwi', 'hol'],
// Limits
chlMin: -0.005,
chlMax: 0.05,
tssMin: 0.075,
tssMax: 0.185,
waterMax: 0,
cloudMax: 0.02,
// Graphics
foreground: 'default',
foregroundOpacity: 1.0,
background: 'default',
backgroundOpacity: 1.0
};
Next, we need to comment out the backgroudLayer
returned by getValue
:
// if (!isWater(indices.watermask, params.watermaskIndices, params.waterMax, params.cloudMax, isSentinel3)) {
// return backgroundLayer;
// }
Finally, we set the alg
as rlh
(line 297) and return chlIndex
(line 327):
const alg = chl === 'default' ? (isSentinel3 ? 'rlh' : 'mci') : chl;
// return foregroundOpacity === 1 ? value : blend(value, backgroundLayer, foregroundAlpha, 100 - foregroundAlpha);
return nchlIndex]
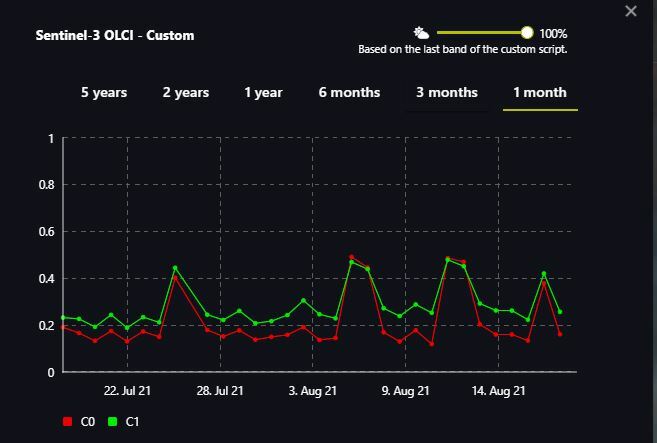
The quick fix allows you to get the statistics of index correctly, but you can barely see anything on the screes as the value of index is too small.
Best Regards