
Temporal analysis - burned area


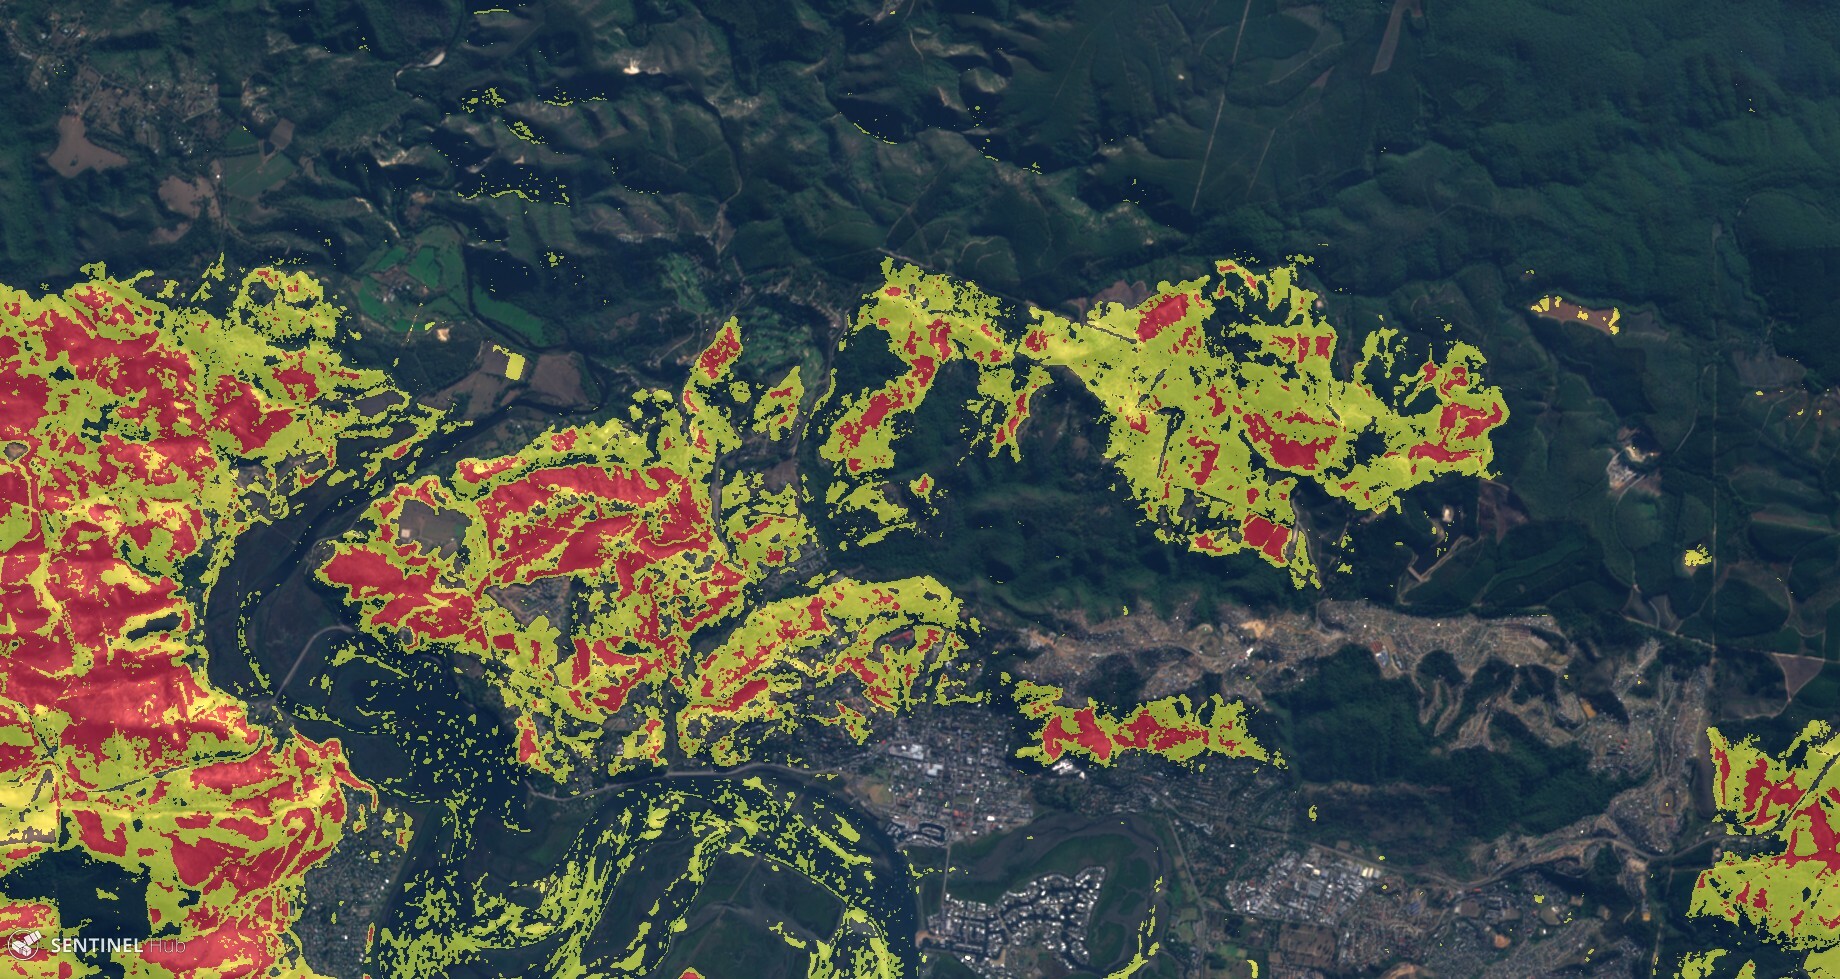
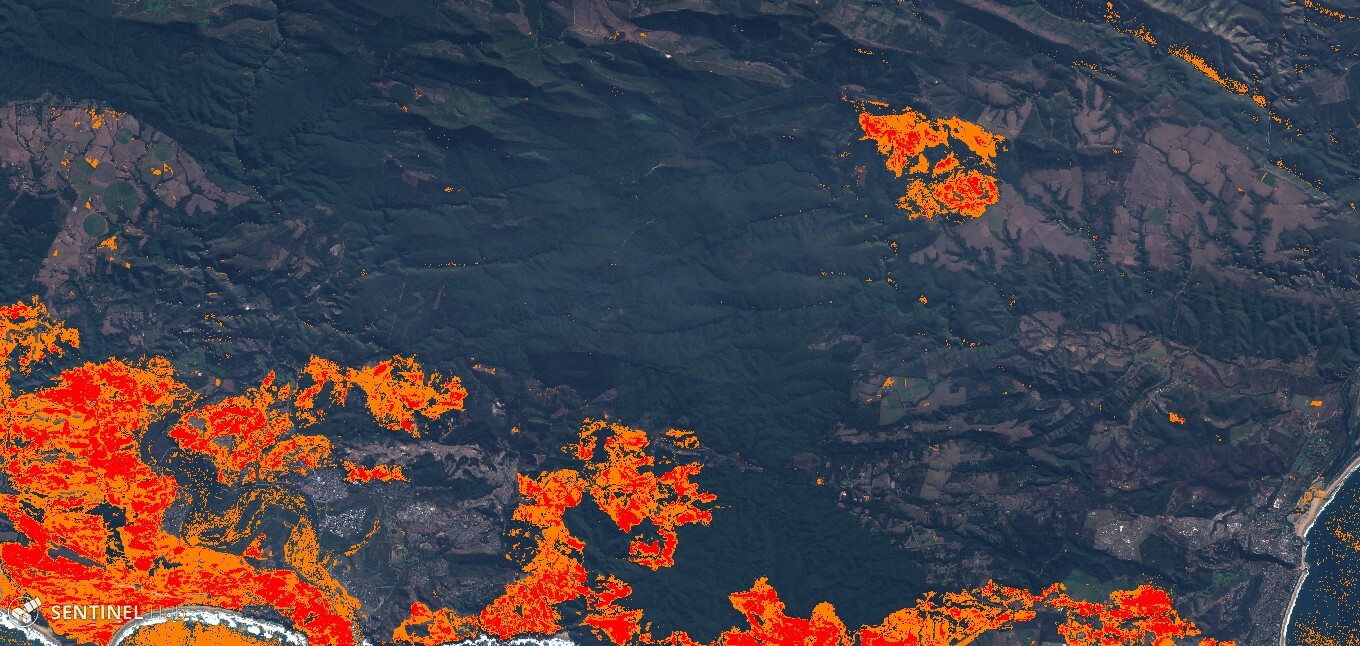
I am attempting to do a burn scar analysis by getting the difference between the Normalized Burn Ratio of two scenes from different dates. It must be possible to do it in Playground with a custom script, but how would one go about doing that?

Regards

Try this script:


function    setup (dss) {
setInputComponents([dss.B08,dss.B12]);
setOutputComponentCount(1);
}

function filterScenes (scenes, inputMetadata) {
return scenes.filter(function (scene) {
return scene.date.getTime()>=(inputMetadata.to.getTime()-2*31*24*3600*1000) ;
});
}

function calcNBR(sample) {
var denom = sample.B08+sample.B12;
return ((denom!=0) ? (sample.B08-sample.B12) / denom : 0.0);
}

function evaluatePixel(samples,scenes) {
var nbrpre = 0;
var nbrpost = 0;

var endMonth = scenes[0].date.getMonth();
var startMonth = scenes[scenes.length-1].date.getMonth();

for (var i=0;i<samples.length;i++) {

if (scenes[i].date.getMonth()==endMonth){
nbrpost = calcNBR(samples[i]);
}
if (scenes[i].date.getMonth()==startMonth){
nbrpre = calcNBR(samples[i]);
}
}
var dnbr = nbrpre - nbrpost;
return [dnbr];
}

In case you want to compare two specific dates, you might use something along the lines of:


function filterScenes (scenes, inputMetadata) {
return scenes.filter(function (scene) {
var allowedDates = ["2017-11-05","2017-12-05"];

var sceneDateStr = getDateInISO(scene.date);
if (allowedDates.indexOf(sceneDateStr)>=0) return true;
else return false;
});
}

in the filterScenes section.

To do this in a dynamic fashion, you would want to use EVALSCRIPT parameter - e.g. prepare the script in your application, then encode it (BASE64) and then pass it as EVALSCRIPT.


Thanks, your help is much appreciated! I got the results I wanted with the script below:

    function setup (dss) {
// get all bands for display and analysis
setInputComponents([dss.B02,dss.B03,dss.B04,dss.B08,dss.B12]);
// return as RGB
setOutputComponentCount(3);
}

function filterScenes (scenes, inputMetadata) {
return scenes.filter(function (scene) {
// set dates for pre-and-post fire analysis
var allowedDates = ["2017-05-15","2017-06-24"]; // Knysna fires
// format scene date timestamp to match allowed dates
var sceneDateStr = dateformat(scene.date);
if (allowedDates.indexOf(sceneDateStr)!= -1) return true;
else return false;
});
}

// Normalized Burn Ration calculation
function calcNBR(sample) {
var denom = sample.B08+sample.B12;
var nbrval = ((denom!=0) ? (sample.B08-sample.B12) / denom : 0.0);
return nbrval;
}

function dateformat(d){
var dd = d.getDate();
var mm = d.getMonth()+1;
var yyyy = d.getFullYear();
if(dd<10){dd='0'+dd}
if(mm<10){mm='0'+mm}
var isodate = yyyy+'-'+mm+'-'+dd;
return isodate;
}

function evaluatePixel(samples,scenes) {
var nbrpre = 0;
var nbrpost = 0;

// get pre-fire image
nbrpre = calcNBR(samples[1]);
// get post-fire image
nbrpost = calcNBR(samples[0]);
// get difference
var dnbr = nbrpre - nbrpost;
// set output display layers
var NaturalColors = [3 * samples[0].B04, 3 * samples[0].B03, 3 * samples[0].B02];
var burnModerate = [1,0.5,0];
var burnSevere = [1,0,0];
return (dnbr < 0.27 ?
NaturalColors : (dnbr < 0.66 ?
burnModerate : burnSevere)
);

}

That looks great. Thanks for sharing it.


An example here (make sure to switch on Temporal processing in Effects pane)

e42186d3f743e1b201b5156361b423ed43dd1d6c.pngSentinel Playground
0d605cf007e70fef63de75e75f6672e960701301.jpg

Sentinel Playground


Sentinel Playground application for playing with Sentinel satellite imagery


A little tweaked for nicer visuals:


function setup (dss) {
// get all bands for display and analysis
setInputComponents([dss.B02,dss.B03,dss.B04,dss.B05,dss.B08,dss.B12]);
// return as RGB
setOutputComponentCount(3);
}

function stretch(val, min, max) {return (val - min) / (max - min);}

function filterScenes (scenes, inputMetadata) {
return scenes.filter(function (scene) {
// set dates for pre-and-post fire analysis
var allowedDates = ["2017-05-15","2017-06-24"]; // Knysna fires
// format scene date timestamp to match allowed dates
var sceneDateStr = dateformat(scene.date);
if (allowedDates.indexOf(sceneDateStr)!= -1) return true;
else return false;
});
}

// Normalized Burn Ration calculation
function calcNBR(sample) {
var denom = sample.B08+sample.B12;
var nbrval = ((denom!=0) ? (sample.B08-sample.B12) / denom : 0.0);
return nbrval;
}

function dateformat(d){
var dd = d.getDate();
var mm = d.getMonth()+1;
var yyyy = d.getFullYear();
if(dd<10){dd='0'+dd}
if(mm<10){mm='0'+mm}
var isodate = yyyy+'-'+mm+'-'+dd;
return isodate;
}

function evaluatePixel(samples,scenes) {
var nbrpre = 0;
var nbrpost = 0;

// get pre-fire image
nbrpre = calcNBR(samples[1]);
// get post-fire image
nbrpost = calcNBR(samples[0]);
// get difference
var dnbr = nbrpre - nbrpost;
// set output display layers
var stretchMin = 0.05;
var stretchMax = 1.00;
var NaturalColors = [stretch(2.8 * samples[0].B04 + 0.1 * samples[0].B05, stretchMin, stretchMax), stretch(2.8 * samples[0].B03 + 0.15 * samples[0].B08, stretchMin, stretchMax), stretch(2.8 * samples[0].B02, stretchMin, stretchMax)];
var burnModerate = [stretch(2.8 * samples[0].B04 + 0.1 * samples[0].B05, stretchMin, stretchMax)+0.5, stretch(2.8 * samples[0].B03 + 0.15 * samples[0].B08, stretchMin, stretchMax)+0.5, stretch(2.8 * samples[0].B02, stretchMin, stretchMax)];
var burnSevere = [stretch(2.8 * samples[0].B04 + 0.1 * samples[0].B05, stretchMin, stretchMax)+0.5, stretch(2.8 * samples[0].B03 + 0.15 * samples[0].B08, stretchMin, stretchMax), stretch(2.8 * samples[0].B02, stretchMin, stretchMax)];
return (dnbr < 0.27 ?
NaturalColors : (dnbr < 0.66 ?
burnModerate : burnSevere)
);

}


Link


Very nice! Thanks.


I have committed the script to Custom script github repository.


Thanks to both.


Hi ! I found very interesting what you are doing.
I tried to run the scrypt on the playground with out success. I zoomed in a area where i know a fire scar, and changed the pre and post fire dates. Should i change any other parameter?

Thanks in advance


Hi,

you need to use the “temporal” playground app, which is in prototype mode, e.g.:

e42186d3f743e1b201b5156361b423ed43dd1d6c.pngSentinel Playground 0d605cf007e70fef63de75e75f6672e960701301.jpg

Sentinel Playground

Sentinel Playground application for playing with Sentinel satellite imagery


And then do as you suggested.
If it does not work, let me know, which area you are looking at and which are the dates, so that we can debug.

Best


So many thanks! Nice job!

It could be very interesting to export the results into a vectorized polygon, do you think is possible in this environment?

Cheers

Fires in Córdoba, Argentina


Looks nice, thanks for sharing.

Vectorized polygon is an output option, see:
https://sentinel-hub.com/develop/documentation/api/output-formats

You would need to configure your Sentinel Hub account properly and then call the service via API though.


Hi,

Great script and idea, up until I came across this I had been downloading terabytes of sentinel 2 to calculate difference NBR. However, I cannot see to get the above script to work in the Sentinel Hub Playground (“Error loading image:”), I am a complete noob to this platform. Do you mind please pointing me in the right direction?

Thanks in advance.

Kind regards


Hi,
did you use “Temporal version of Sentinel Playground” as linked here:

Hi Nicolas, you need to use the “temporal” playground app, which is in prototype mode, e.g.: And then do as you suggested. If it does not work, let me know, which area you are looking at and which are the dates, so that we can debug. Best, Grega

Or try one link directly as described here:
Temporal analysis - burned area?


Hi


Thank you very much for the very interesting script. It is great.


I’m probably asking something very simple, but my problem is that I’m not a programmer. I don´t know if it is possible to use a script like this in “wms configurator”.


In my case what I need is an image resulting from subtracting NDVI values between two dates. But trying to make you more simple, if you can tell me how to use the “Burned area temporal analysis” script in “wms configurator” it would be great. Then I will try to adapt it to what I need.


It is not urgent and thank you very much for you time


Thank you for the script and for the tweaked version, it works great!

I tried to run the script also in Sentinel EO Browser but it didn’t work. I guess it does work only in the Playground Temporal web app?


You are right, multi-temporal processing is not yet supported in EO Browser, which was designed to show data from single time slices. We do plan to update this, but not one of the top priority features.

You can obviously take EO Browser application source-code and deploy your own, modified, version:

favicon.svgGitHub
2ce458ca86f2fe0f44b5e380e75bf01c7668d580.png


GitHub - sentinel-hub/EOBrowser: The Earth Observation Browser is a search...


The Earth Observation Browser is a search tool for Sentinel-1, -2, -3, Landsat 5, 7, 8, Modis and Envisat satellite imagery - GitHub - sentinel-hub/EOBrowser: The Earth Observation Browser is a sea...


Hello

Thank you very much for the reply. It’s great if this option is implemented in the future. Anyway, EO Browser is still very useful and the statistical info option is already very interesting for temporary analysis.

Greetings.


It is possible to understand how to export the analysis performed as a script.

grazie


You can use OGC API to do so:
https://www.sentinel-hub.com/develop/documentation/api/ogc_api


Sorry for the question, but I can’t make this step to download the data.

could you help me if you know a tutorial.

I should do a task but I don’t know the construction of the API very well.

Thanks for your help


Hi,Thank you for the script. I tried running it for my area but it returned a black image. @pierre.markuse ,@fcbasson and @gmilcinski could you please give me ideas on how to customize it to fit my area. What parameters do I need to change/add on the script?


Please note I have no programming skills, I am still trying to teach myself programming.


Hi, ive noticed to get it working you must do a few things in playground.

  1. Zoom in to your area of interest (hint this is only likely to work if your in one Row/Path ie square of satelite imagery, but they are large should you are mostly right
  2. Click on the date selector in playground find before and after dates for which images were taken that day (you can tell by the light grey circle that pops up.
  3. Select the after date from this menu
  4. Also change the dates in the script to those dates
  5. Note the current image displayed (controlled by the date selector in playground can be anytime after but not before or during the dates inputed into the script

Im trying to get this working in EO Hub as WMS service, can anyone help what programing tweaks are required?


Hi,
can you be a bit more specific into what exactly you want to do? Not sure I know what is EO Hub.

That being said, in order to make it work through WMS, you will have to tweak the dates of the data to be compared in the Custom script, then Base64 encode this script and send it to the WMS end-point as an EVALSCRIPT parameter.


Thank you so much for your response, I was able to fit the script to my area and show the fire.


I have been trying to take it to ArcGIS online using WMS service by copying and pasting the script on custom script editor on my WMS templates but it doesn’t work. Please assist on how to get this working


Reply