Hi all,
This is Enes! I am the lead data scientist in an agri-tech company, and we are considering cooperating with Sentinel-Hub for our entire satellite data operations. We have been working on understanding the pipeline. We dived into the documentation page and Medium blog posts. However, we are confused and have several questions.
Task: Crop classification and field boundary detection at a large scale.
In this post, I only focus on our requirements for crop classification because it covers the latter.
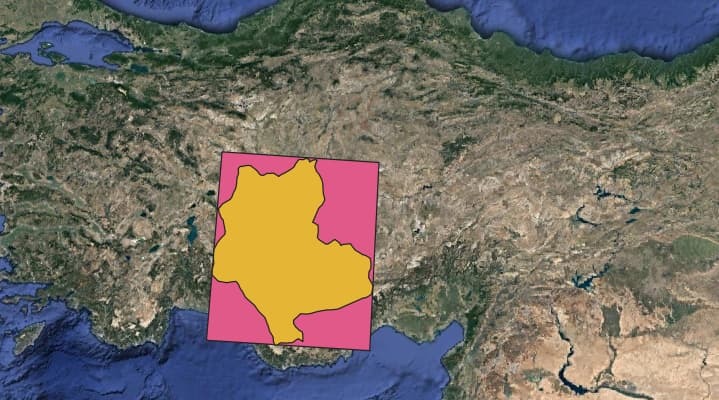
We aim to get regular time-series satellite images for 26 different regions determined. For a given region (ideally the orange area, not the pink one), we have three different scenarios:
Scenario 1: Download weekly Sentinel-2 median mosaics. Impute the cloudy pixels with temporal imputation. Download weekly Sentinel-1 (radar) mosaics.
Scenario 2: Allowing a dynamic time range for Sentinel-2 median mosaics. In this case, I expect the time range expands until we reach a pre-specified cloudless pixels percentage. For instance, in March we might have a monthly mosaic, but in July, we might have more frequent cloudless mosaics. Download weekly Sentinel-1 (radar) mosaics.
Scenario 3: Download monthly Sentinel-2 median mosaics (assuming that the percentage of cloudy pixels is below a certain threshold). Download weekly Sentinel-1 (radar) mosaics.
Questions
1- What is the optimal way to implement the scenarios above? Can we implement the mosaic with a dynamic time-range case in Sentinel-Hub?
2- Do you provide any services for the temporal imputation in Scenario-1?
3- Is it possible to download the orange (or pink) mosaic i.e. can Sentinel-Hub take care of the stitching process?
4- We have ground-truth field samples. We aim to construct a tabular database on PostgreSQL for our machine learning operations. If we provide the vector data set, do you have any service to help us fill the database in a column-wise expanding manner based on the scenarios I mentioned above? Please see the visualization on the second post to better understand database structure.
You can find an example region below.
The Bbox = (31.3113317420176180, 36.3997020087171350, 34.4186815229763141, 39.2964617824208986).
Finally, could you please provide us with a trial period for Batch Processing API to test the system?
Thank you very much.


