Hi team,
I’m currently working on a project involving SH Statistics API and have encountered some challenges that I’m hoping to find solutions or suggestions for.
Objective:
Extract a time series of Planet Fusion quality metric , specifically when the QA band is equal to 0, on a tile level.
Challenge:
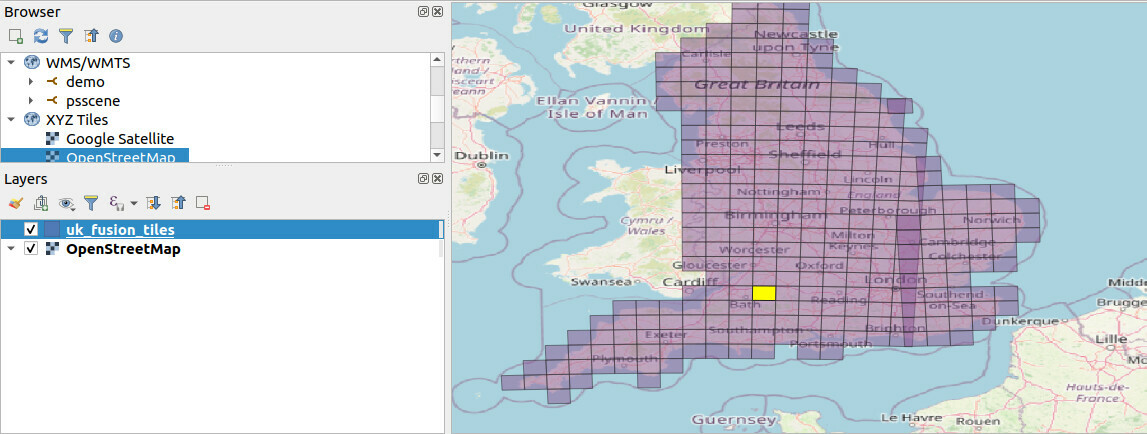
- Scale: We have a 3m fusion tile every day and the geometries involved are quite substantial in size. The maximum resolution of my collection is 500m, which does not seem to make much of a difference.
Issues:
- Timeout Error: A persistent time_out error occurs during getting the data.
- Download duration: Even after adjusting
SHConfig(max_download_attempts=50), the download times never succeed.
Alternative being considered:
I’m considering avoiding the client to get a better understanding of the response.
Questions
- Has anyone experienced similar issues related to timeouts or extended download times with SentinelHub, especially when dealing with large geometries?
- Is there an alternative approach to extract time series more optimally without encountering these issues, perhaps batch?
- Any insights or suggestions for handling data extraction and management efficiently in this context?
Additional Information
> import geopandas as gpd
> from sentinelhub import (
>     CRS,
>     DataCollection,
>     Geometry,
>     SentinelHubStatistical,
>     SHConfig,
> )
>
> from .constants import COLLECTION_ID
> import logging
>
> logging.basicConfig(level=logging.INFO)
>
> evalscript = """
> //VERSION=3
> function setup() {
>   return {
>     input: [{
>       bands: [
>         "QA2",
>         "dataMask"
>       ]
>     }],
>     output: [
>       {
>         id: "data",
>         bands: 1
>       },
>       {
>         id: "dataMask",
>         bands: 1
>       }]
>   }
> }
> function evaluatePixel(sample) {
>     return {
>         data: [sample.QA2 == 0],
>         dataMask: [sample.dataMask]
>         }
> }
> """
>
> gdf = gpd.read_file(
>     "/path/to/tiles.geojson"
> ).to_crs(3857)
> gdf = gdf.explode().reset_index(drop=True)
> geom = gdf.geometry.values[0]
>
> config = SHConfig(max_download_attempts=100)
> aggregation = SentinelHubStatistical.aggregation(
>     evalscript=evalscript,
>     time_interval=("2022-01-01", "2023-08-01"),
>     aggregation_interval="P1D",
>     resolution=(500, 500),
> )
> request = SentinelHubStatistical(
>     aggregation=aggregation,
>     input_data=[
>         SentinelHubStatistical.input_data(
>             DataCollection.define_byoc(COLLECTION_ID),
>         ),
>     ],
>     geometry=Geometry(geom, CRS(gdf.crs)),
>     config=config,
>     data_folder="/path/to/dir",
> )
>
> response = request.get_data(show_progress=True, save_data=True)
Tile size:


