I used python rioxarray_open.rasterio to load the Sentinel2 pixels values and plot the results in QGIS.
pixel_value = rioxarray.open_rasterio("root/32DPD_20220101T102431_B04.jp2")
pixel_value = pixel_value.squeeze()
gdf_pixel_value = pixel_value.to_dataframe().reset_index()
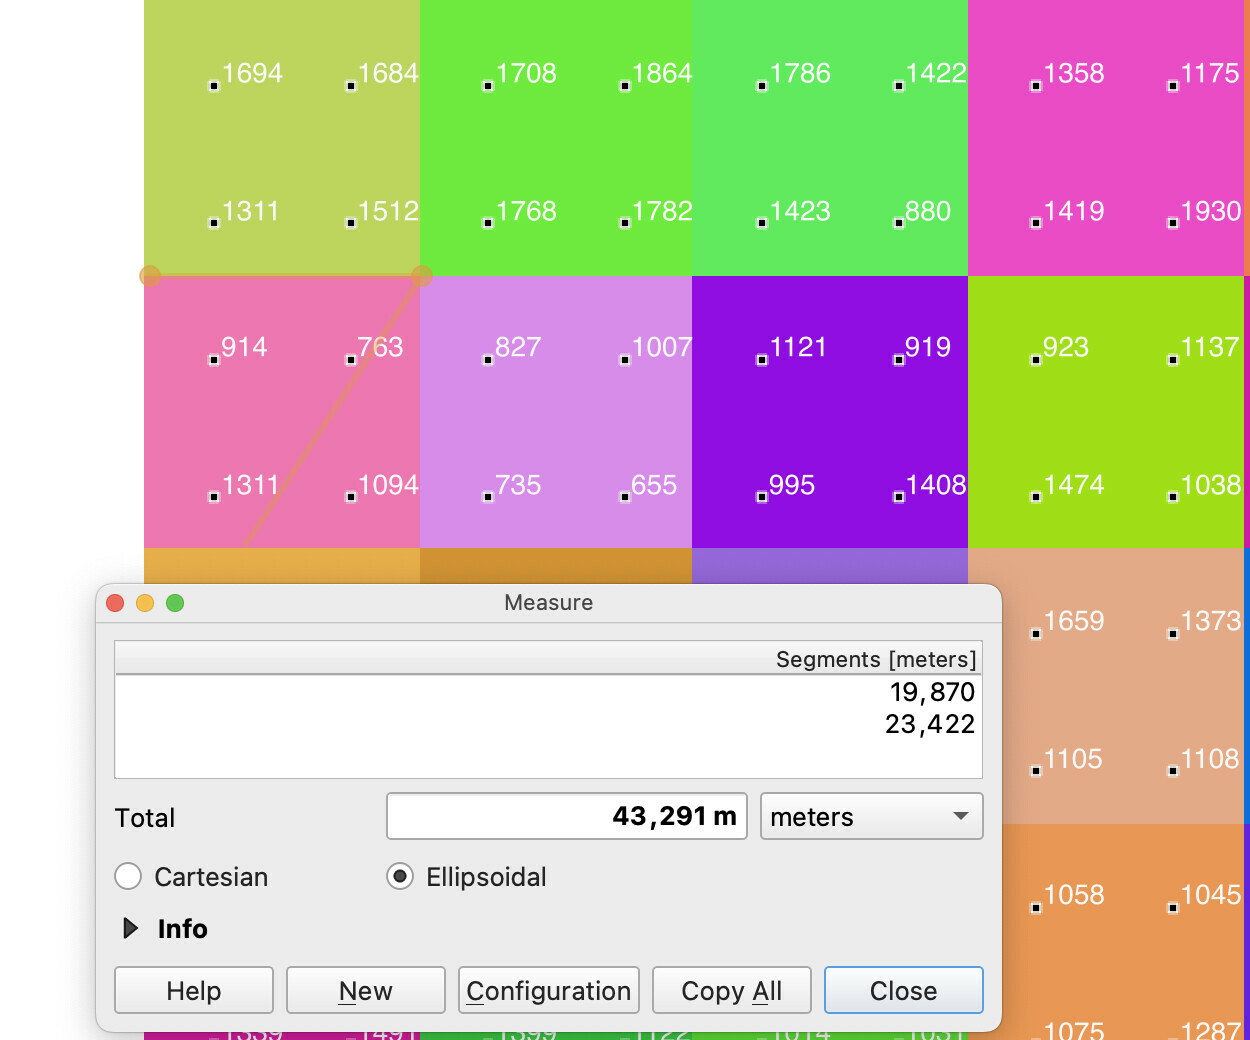
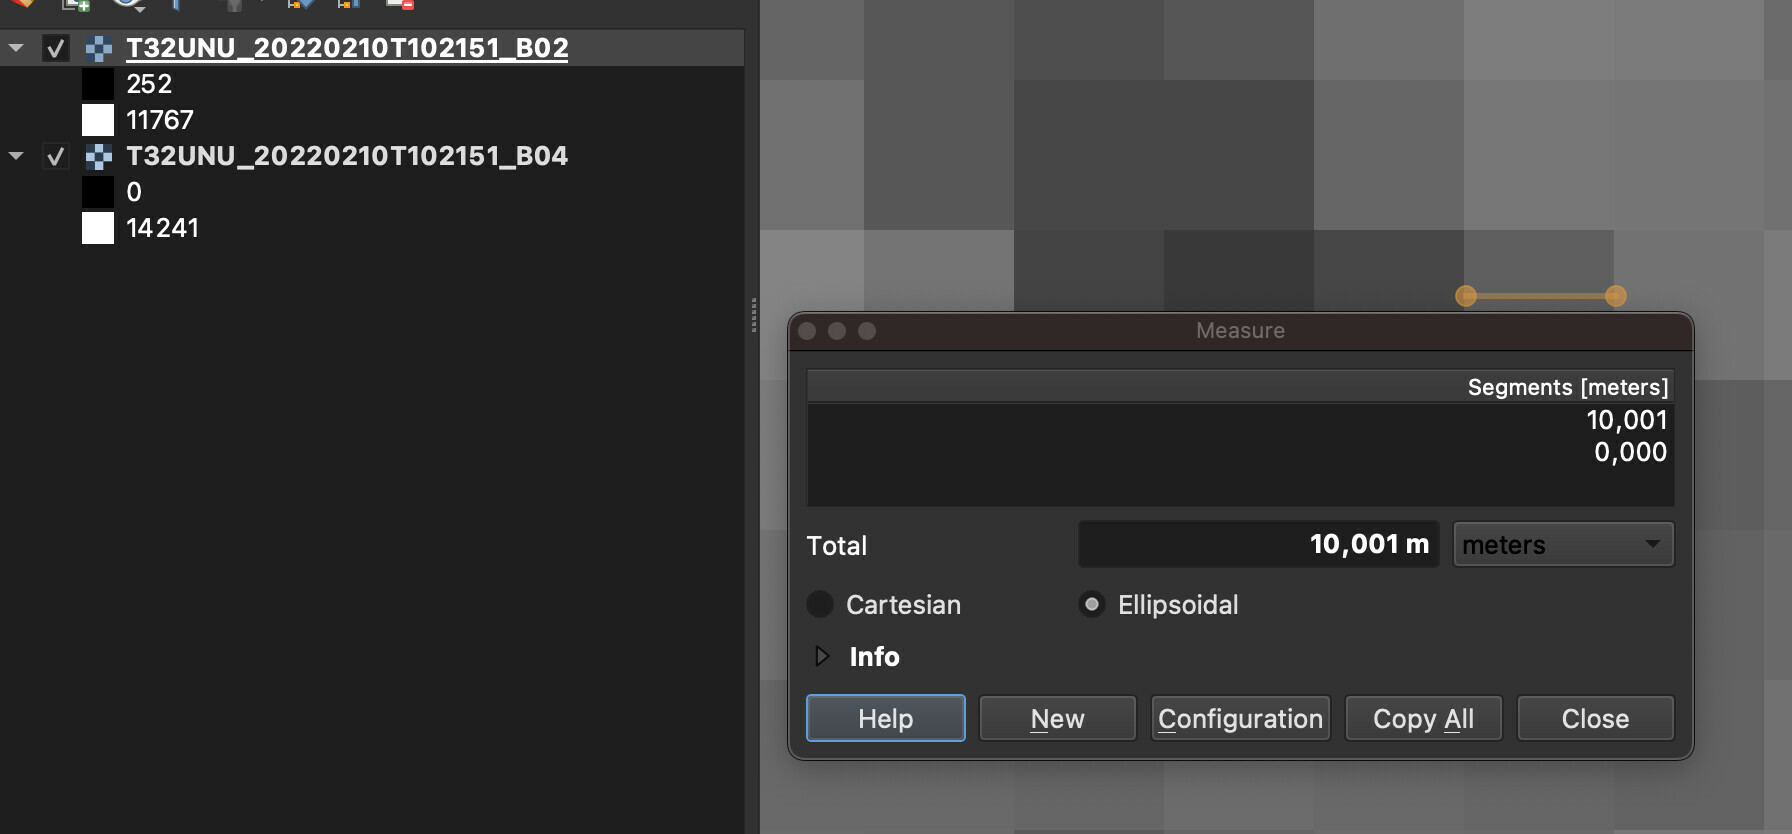
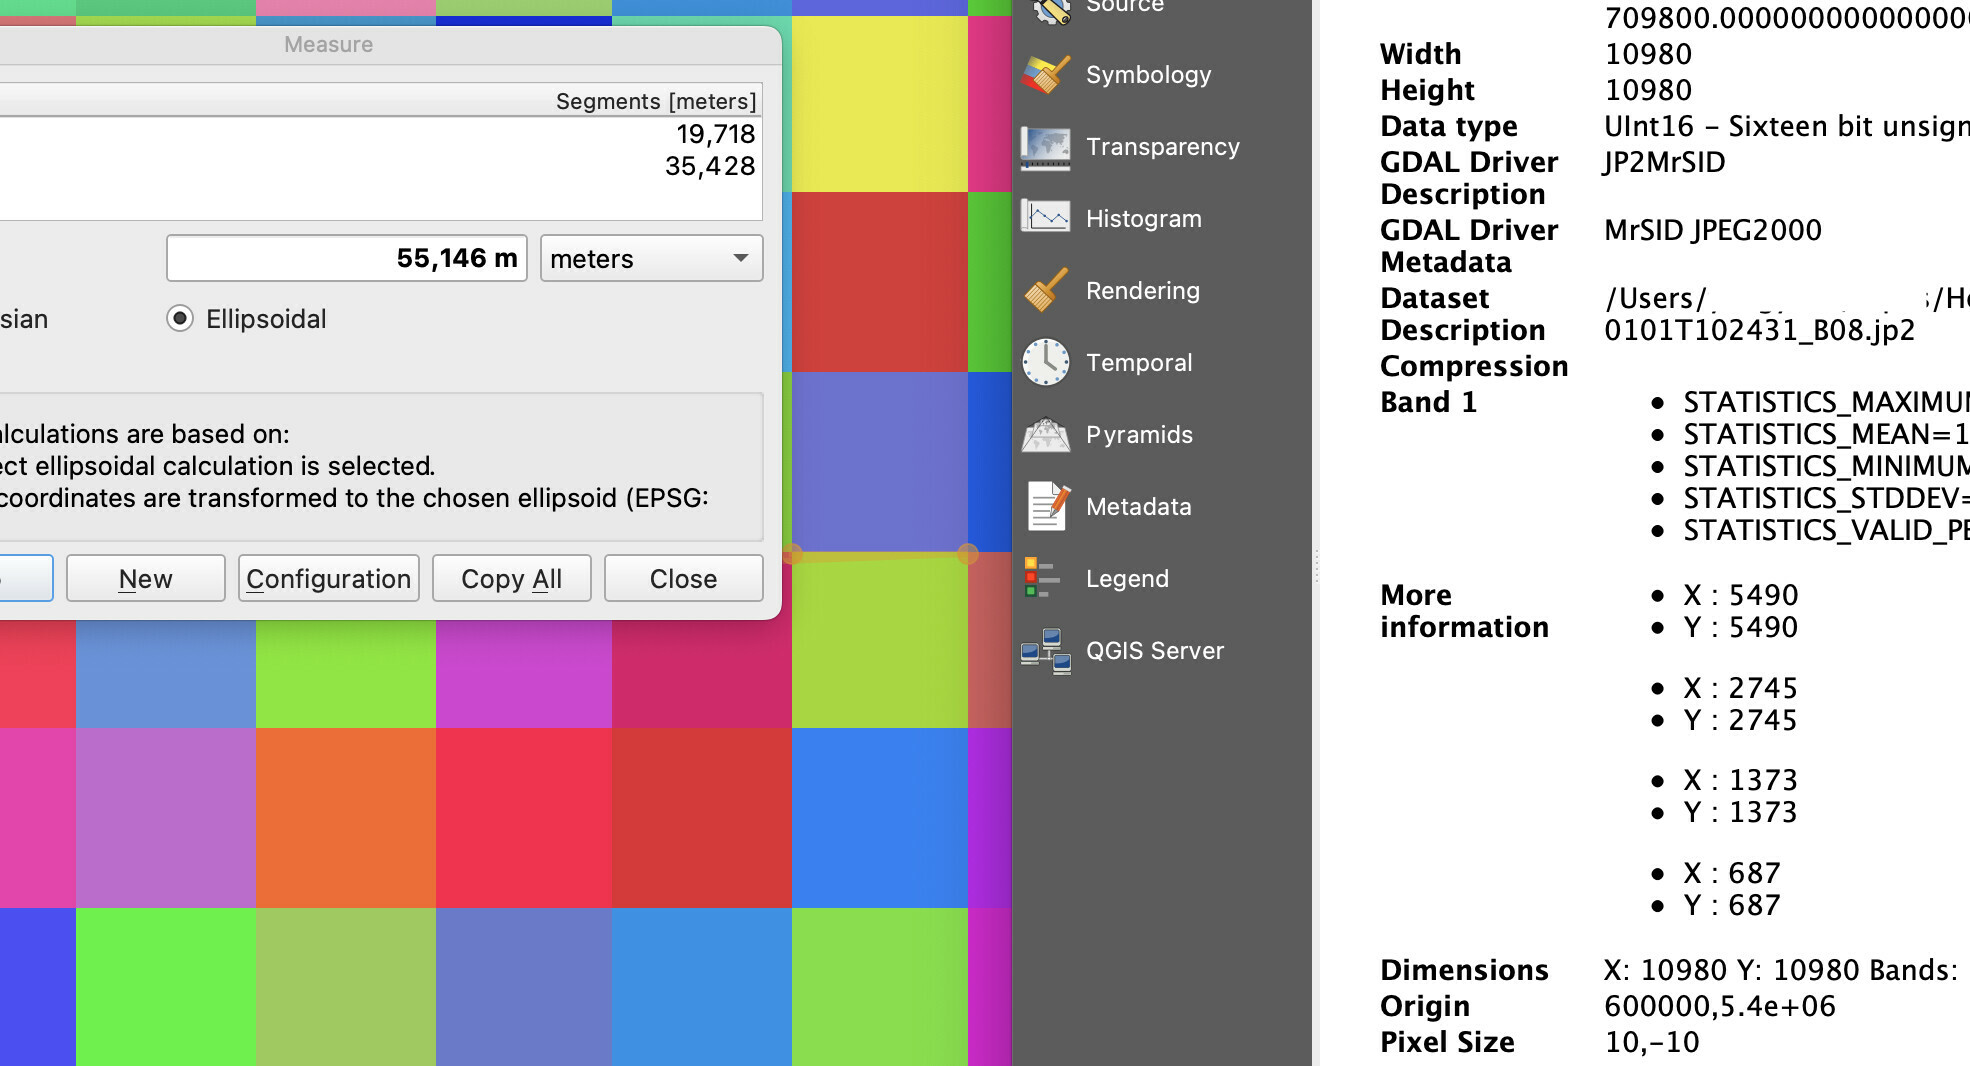
For testing, I just load a sub-region of the band - 100*100pixels. The result I got was promising, with 10,000 values (digital numbers). But after I plot it in QGIS, it is strange. Different values should have different grayscales/colors, but you could see that every four neighbor pixels are exactly the same color.
I changed the symbology with “unique value” to better distinguish the grayscales. Now you can clearly see that four different pixels share the same color:
Why would this happen? Many thanks in advance!
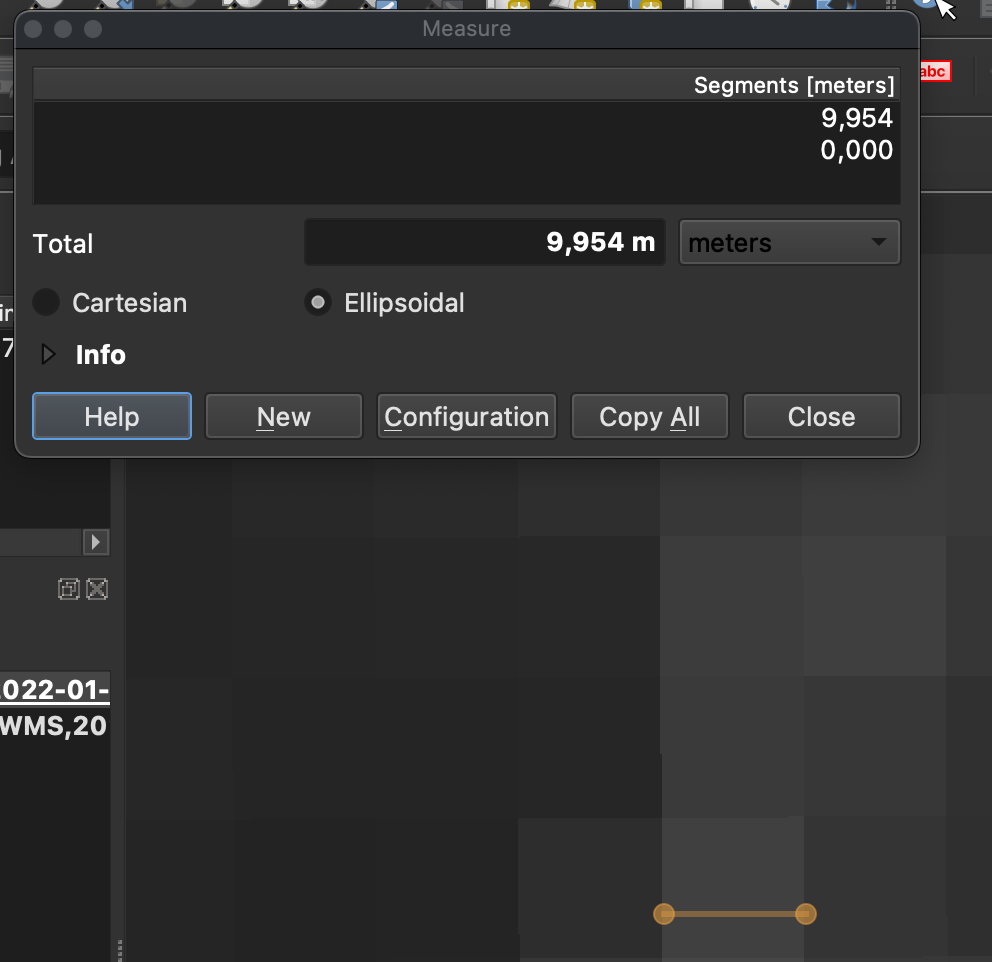
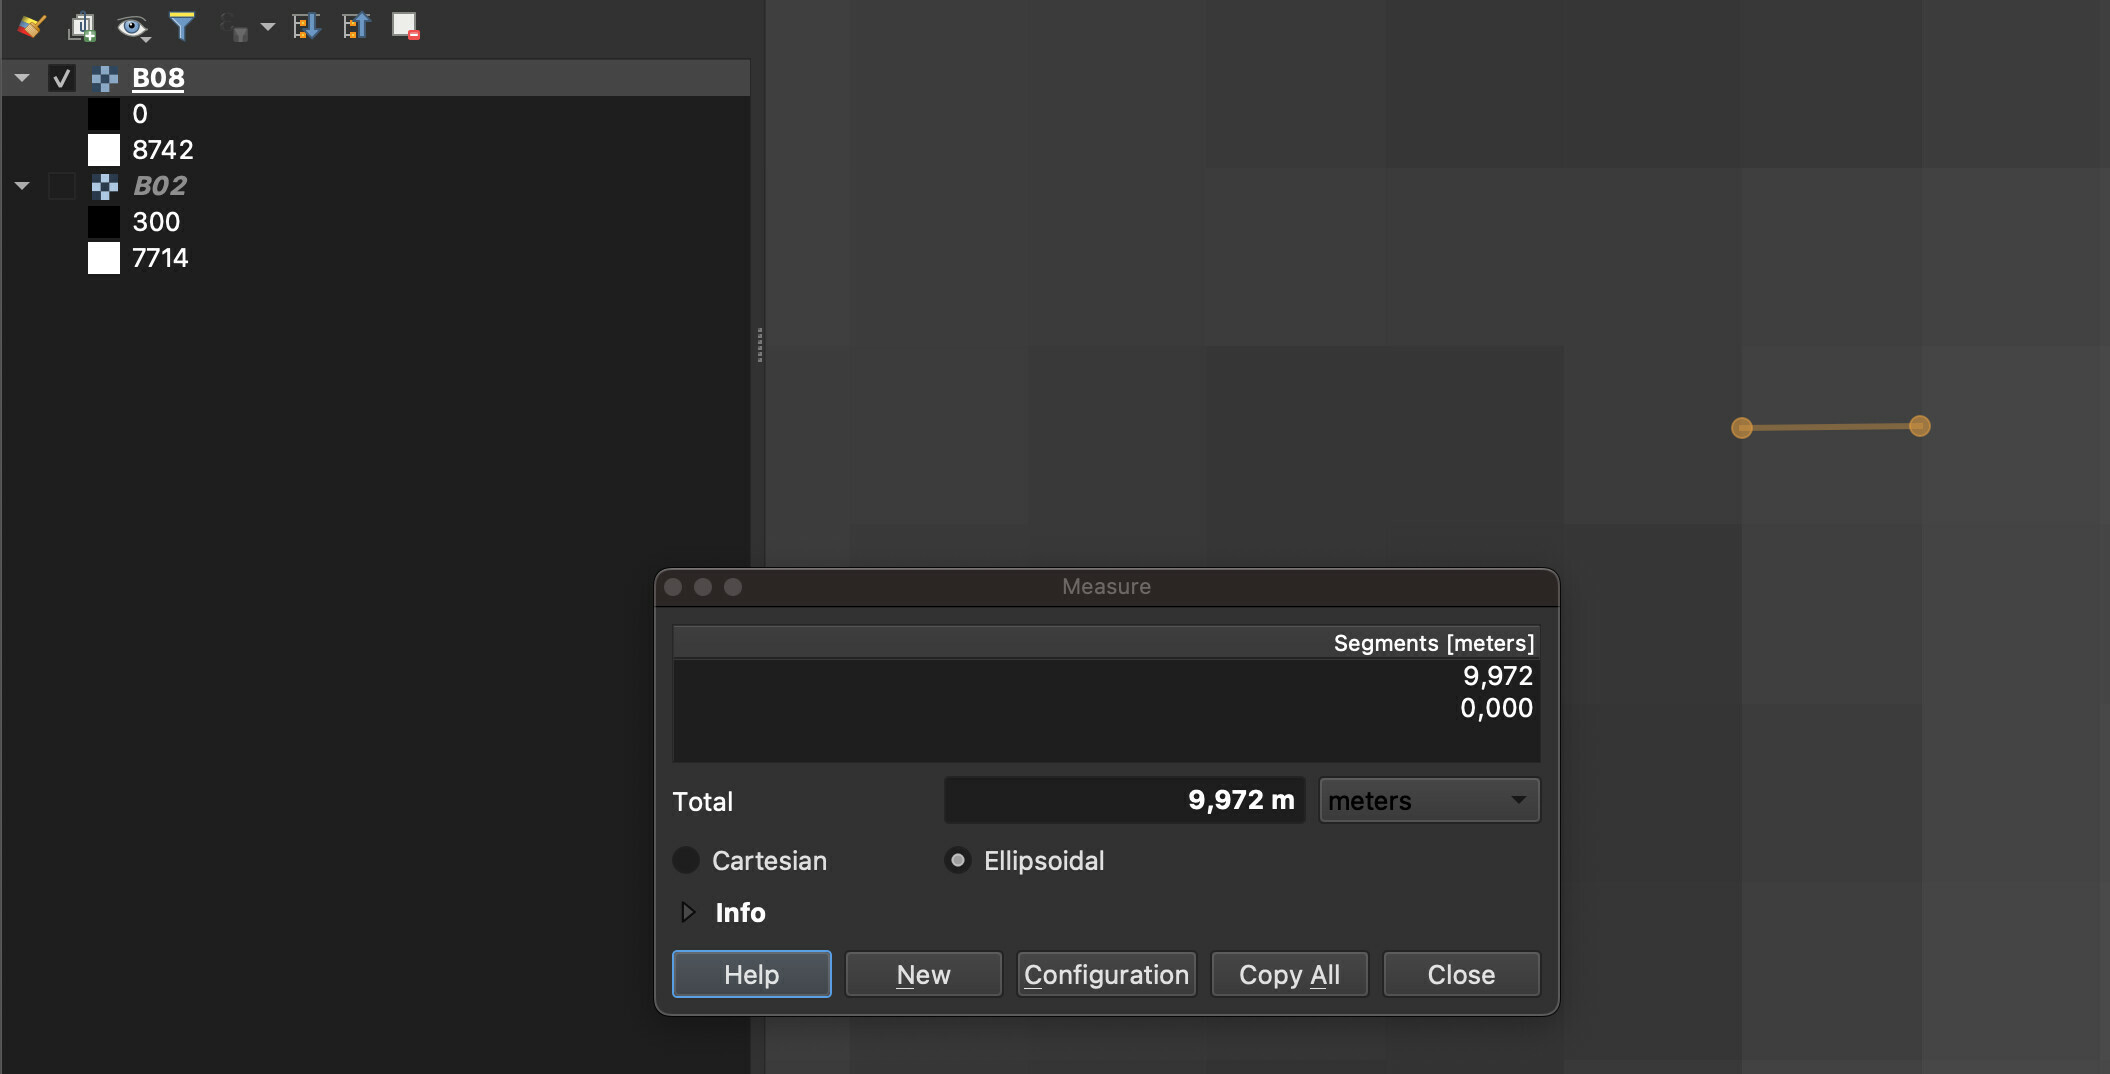
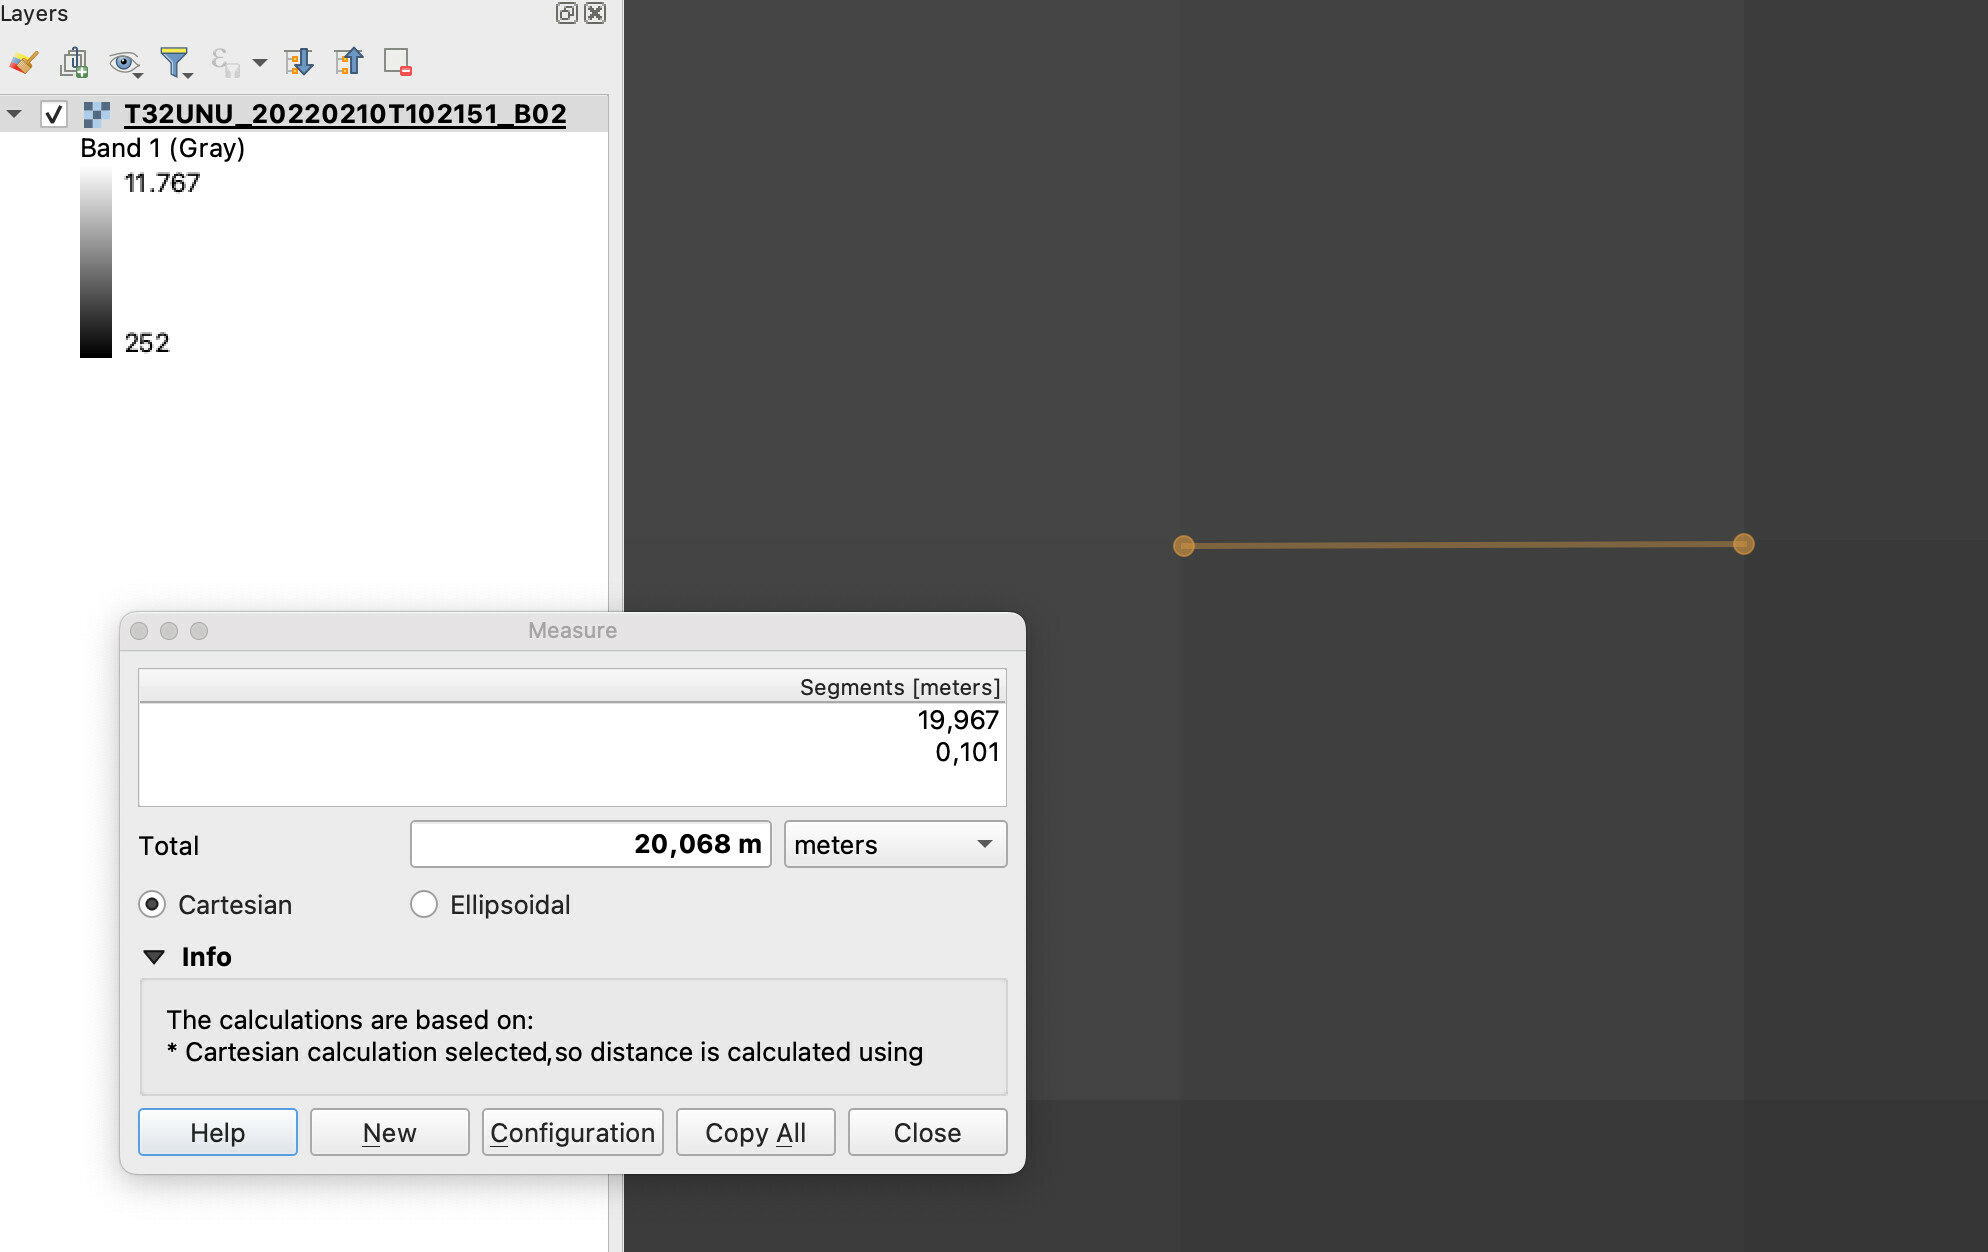
See below:

