I have the following bbox:
bbox_coords_wgs=[-47.949734553694725, -8.746513680257486,-47.9345985129475,
 -8.717573061584929]
I’m using evaluate script in order to retrieve image for this bounding box:
#Time Interval for images
time_interval = ('2020-12-31', '2021-01-10')


evalscript = """
    //VERSION=3


    return [VV,VH, dataMask]
"""

time_interval = time_interval

request = SentinelHubRequest(
    data_folder='sen1_test3',
    evalscript=evalscript,
    input_data=[
        SentinelHubRequest.input_data(
            data_collection=DataCollection.SENTINEL1_IW,
            time_interval=time_interval,
            other_args = {"dataFilter":{"demInstance":"COPERNICUS_30"},"processing":{"orthorectify":True,"backCoeff":"SIGMA0_ELLIPSOID"}}
        )

    ],
    responses=[
        SentinelHubRequest.output_response('default', MimeType.TIFF)
    ],
    bbox=bbox,
    config=config
)

image = request.get_data(save_data=True)

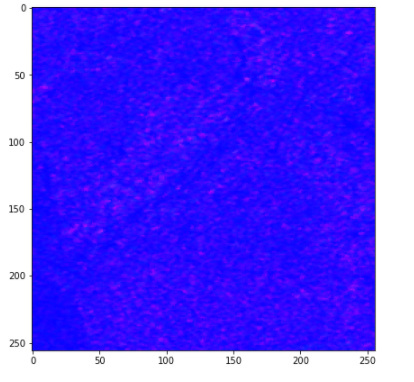
plot_image(image[0], factor=1)
the result image looks like this:
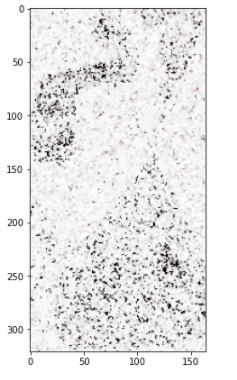
Then when I do the same with WMSrequest I get different shape (the correct shape):
s1_request = WmsRequest(
    data_collection=DataCollection.SENTINEL1_IW,
    layer='TRUE-COLOR-S1-IW',
    bbox=bbox,
    time=('2020-11-01', '2021-01-10'),
    width=bbox_size[0],
    config=config
)

s1_data = s1_request.get_data()

is important to mention that in the wms request the bands that suppose to be return are:
return [VV,VH, 2 * VH, VV / VH / 100.0]
why is it different?
Best regards
Reut


