
Hello! I have this
from my teacher (I’m a student). I need to display the image in RGB format, using the channels 4, 3, 2. I did that, and I managed to view the images (I tried with 2 for starters, but I will visualize all 12 of them).
The code I used is: import os
import cv2
import numpy as np
import matplotlib.pyplot as plt
import rasterio
from skimage import exposure, filters
def load_rgb_image(folder_path, red_band, green_band, blue_band):
# Lista de nume de fișiere TIF din folder
file_names = os.listdir(folder_path)
# Citirea datelor din benzile specifice
bands_data = []
for band in [red_band, green_band, blue_band]:
    band_path = os.path.join(folder_path, band + '.tif')
    with rasterio.open(band_path) as src:
        band_data = src.read(1)
        bands_data.append(band_data)

# Crearea imaginii RGB
rgb_image = np.dstack(bands_data)

return rgb_image
Setare căi către foldere
folder_path_1 = “/content/drive/MyDrive/sentinel/S2A_MSIL2A_20170426T091031_N0204_R050_T35TMK_20170426T091503_buc”
folder_path_2 = “/content/drive/MyDrive/sentinel/S2A_MSIL2A_20170705T090551_N0205_R050_T35TMK_20170705T090814_buc”
Specificarea benzilor roșu, verde și albastru pentru RGB
red_band = “B04”
green_band = “B03”
blue_band = “B02”
Încărcarea imaginii RGB pentru Sentinel-2A
image1 = load_rgb_image(folder_path_1, red_band, green_band, blue_band)
image2 = load_rgb_image(folder_path_2, red_band, green_band, blue_band)
Ajustarea contrastului și luminozității
image1_adjusted = exposure.adjust_gamma(image1, gamma=1.2)
image2_adjusted = exposure.adjust_gamma(image2, gamma=1.2)
Ajustarea contrastului și luminozității folosind ajustare sigmoidală
image1_sigmoid_adjusted = exposure.adjust_sigmoid(image1, cutoff=0.5, gain=10)
image2_sigmoid_adjusted = exposure.adjust_sigmoid(image2, cutoff=0.5, gain=10)
Egalizarea histogramei
image1_eq = exposure.equalize_hist(image1_adjusted)
image2_eq = exposure.equalize_hist(image2_adjusted)
Aplicarea filtrului unsharp
image1_unsharp = filters.unsharp_mask(image1_eq, radius=1.0, amount=1.0)
image2_unsharp = filters.unsharp_mask(image2_eq, radius=1.0, amount=1.0)
Afisare imagini
plt.figure(figsize=(10, 5))
plt.subplot(1, 2, 1)
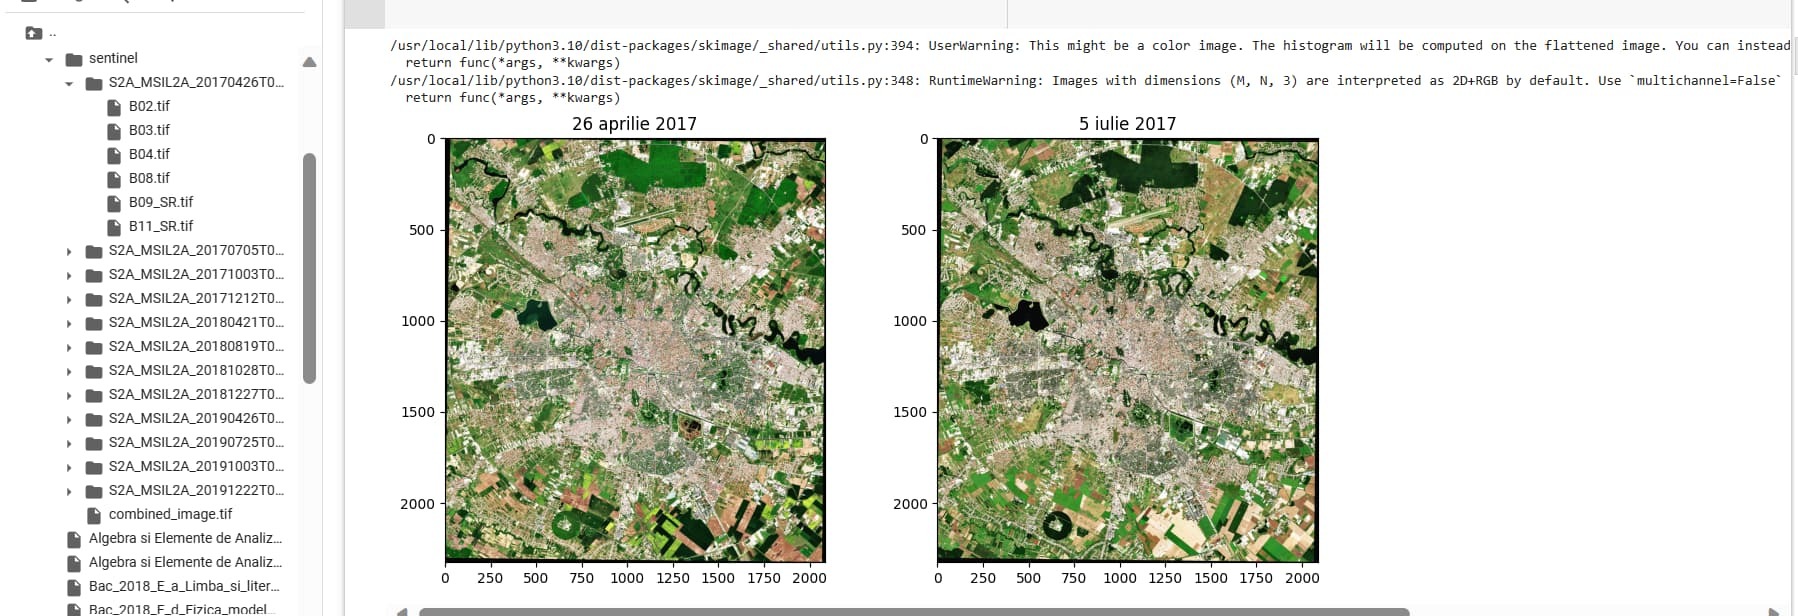
plt.imshow(image1_unsharp, cmap=‘gray’)
plt.title(‘26 aprilie 2017’)
plt.subplot(1, 2, 2)
plt.imshow(image2_unsharp, cmap=‘gray’)
plt.title(‘5 iulie 2017’)
plt.tight_layout()
plt.show()
Now my task is to display the histograms for the three channels, and then calculate the Kullback-Leibler divergence. I tried, but on my code, it doesn’t display anything. It only displays something if I use image1 and image2 (not image1_unsharp, image2_unsharp), but it doesn’t display correctly because the Kullback-Leibler divergence gives me 0 even though the images are different.
I believe I don’t have the correct code for displaying the images, even though I can see them properly. Could you please help me with a correct code to display the histogram and calculate the divergence?

