Hi,
When I search for Sentinel2 images (L2A product, i.e., surface reflectance) I cannot see the QA band (classification band) that usually comes with the L2A images.
How can I get this band so I can overlay it for visualization?
Thanks,
Ran

Hi,
When I search for Sentinel2 images (L2A product, i.e., surface reflectance) I cannot see the QA band (classification band) that usually comes with the L2A images.
How can I get this band so I can overlay it for visualization?
Thanks,
Ran
Check this post
It is now possible to get information from scene classification layer produced by Sen2Cor, for data where L2A is available, of course.
Data can be retrieved by identifier “SCL” (e.g. instead of return uB02]; for blue color one can use return uSCL];).
Data can be then used for e.g. validation of the pixel value, e.g. along the lines:
function validate (samples) {
var scl = Math.round(samples.SCL);
if (scl == 3) { // SC_CLOUD_SHADOW
return false;
} else if (scl == 9) { // SC_CLOUD_…
Hi, thanks, but I’m not sure I understand… I meant- how do I visualize the SCL layer in the UI.
I’m attaching UI menu for visualization which does not contain the SCL option.
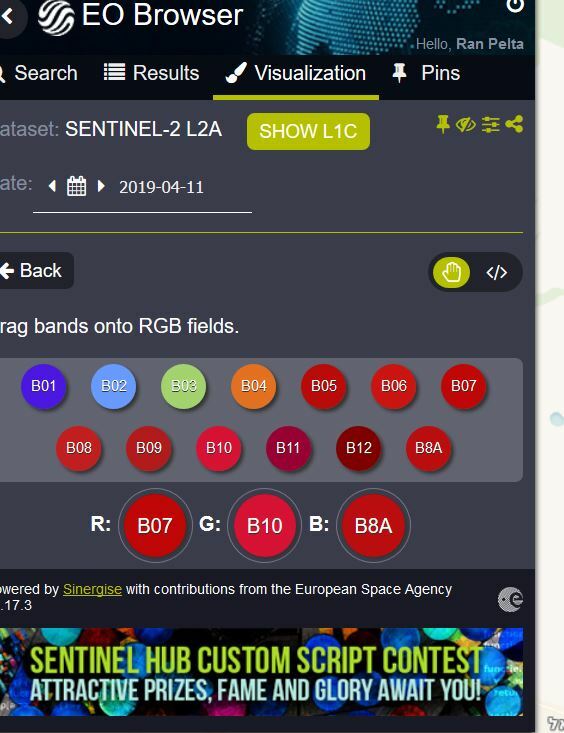
Is there a was to visualize the SCL band? and of course to know the value of a selected pixel?
If you click the yellow switch on the top right part of the screenshot, you can enter the Custom script as presented in the forim thread.
There is no user interface for that
oh, now I see, thanks
Enter your E-mail address. We'll send you an e-mail with instructions to reset your password.
© 2024 Planet Labs PBC. All rights reserved.
|
Privacy Policy | California Privacy Notice |
California Do Not Sell
Your Privacy Choices
| Cookie Notice | Terms of Use
