Hi,
simply said each band contains higher or lower values depending on the intensity of the reflection in the spectrum of the light the band can detect. The spectrum in which each band can detect data is a combination of central wavelength and bandwidth.
This means for example that if you are looking at a forest with dark green color it will have high values in band 3 as band 3 contains the wavelength in which green light reflected the strongest.
Depending on your research question you can combine different bands and their characteristics to make different things visible in the data that comes from the satellite.
If you are interested in learning more about this topic I can recommend you to check up upon optical satellite imagery, on the instrument on board the S2 satellites to measure the light and on spectral signatures of different materials.
Best
Hi,
Your reaction is just not enough information what I currently need. Let me summarize what I need to do:
In my project I have data containing information of a certain pieces of ground. The most important information is the reflectance data of every wavelengths (with steps of 0.5 nm) between 400-2300. My job is to get, with current time data, the wavelengths of a certain piece of ground/place chosen on the world map, to eventually compare it with my project data and use the wavelengths to recognize certain materials (Like carbon) and use it to calculate SOC (https://www.agric.wa.gov.au/measuring-and-assessing-soils/what-soil-organic-carbon)
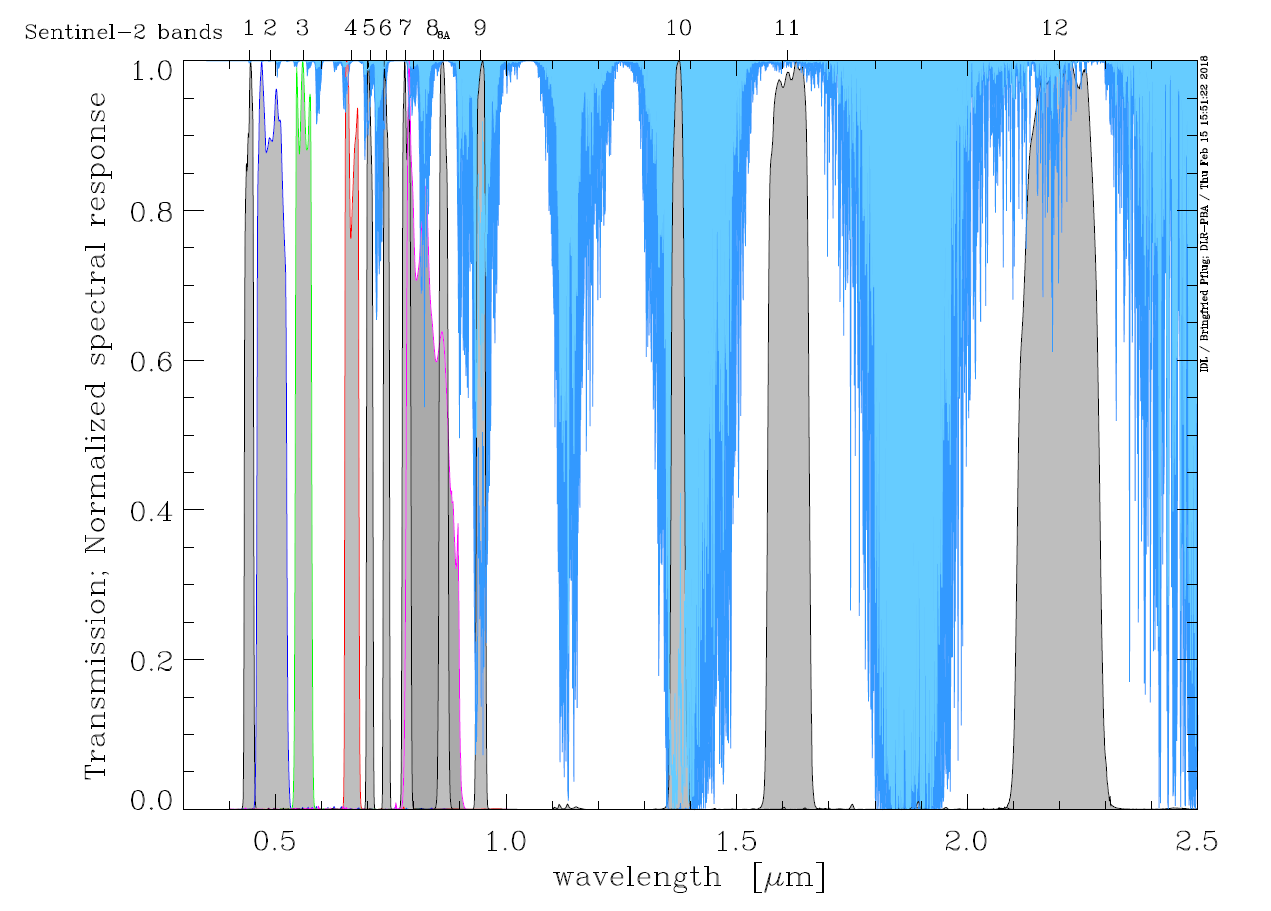
The technical guide that you send does come closely to the answer, but it doesn’t show how you can create a script to get the precise values. The following image:
shows the places where the bands get their piece of data. But I need to get it from almost every wavelength (hopefully steps of 0.5) and then their transmission/reflectance. E.g.: Input: 1534.5 nm → Output: 0.23 transmission. Or a graph like the picture above show for a lot more wavelengths than the band show.
I don’t really understand the capabilities of the MSI what the Guide is showing, but picture does proof that it does use precise inputs to get the output. The guide doesn’t really show how to get this picture. So my question summarized is: How can I get Sentinel 2 data to show me a certain piece of ground, the output of all wavelengths between 400-2300. If this isn’t possible for sentinel 2, please let me know.
Best
Sorry , but it seems to me you are looking for hyper-spectral data, which Sentinel-2 is not. Think of the detectors on Sentinel-2 as collecting (integrating) all wavelengths between given wavelength centre +/- bandwidth (actually, they are weighted with the spectral response function from your post).
Thanks. That is the perfect answer. And also thanks for giving me the right sort of data that I need. This saves me a lot of time and effort
Hi, sorry to re-open this topic.
I try to compute 2 index, REDSI and REHBI. They are using the values of the central wavelength of band (B7,B8,B4 and B5) and they (in the paper) said that they can got them from sentinel-2.
I understand how to get the values of the different band but I search since 2 days and find no ways to set the bandwitdh to 0.
And if i had understand your answer well, you said we can’t @batic ?
Have you find other satellite who give this values @rubenski0345 ?
I precise that I don’t use python for get the values, but sen2cor.
Thanks in advance!
Have a look if any of the indices, provided on custom-scripts repository would be suitable for you. The repository also has a rather large compendium of indices from the indexDB.


