
Dear all,
since a few weeks we configured a Sentinel-1 GRD visualization of the VH polarization as a Sentinel-Hub layer. The script looks like following:
let viz = new ColorMapVisualizer([
  [0, 0x00204D],
  [0.1, 0x575C6D],
  [0.3, 0xA69D75],
  [0.5, 0xFFEA46]
]);

function evaluatePixel(samples) {
	let vh = Math.max(0, Math.log(samples[0].VH) * 0.21714724095 +1);
	return viz.process(vh);
}

function setup(ds) {
    setInputComponents([ds.VH]);
    setOutputComponentCount(3);
}
Since yesterday (2019-08-19) around noon the result image looks completely different when we request the layer from Sentinel-Hub. See the following image, how the visualization was before and after: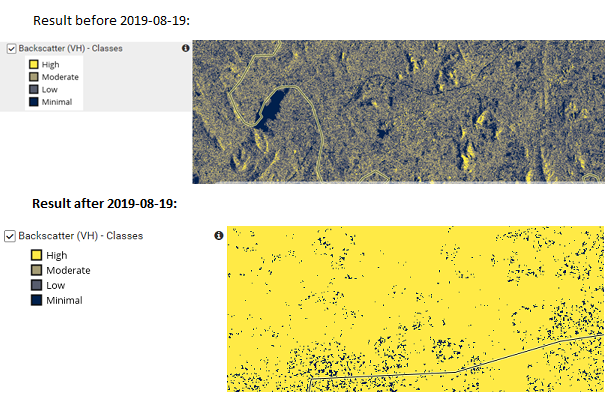
We have not changed the script or the configuration. Are there some changes in the API oder Sentinel-1 GRD data?
Thanks for help!
