I am trying to download the following (S1 GRD AWS Gamma0 linear orthorectified VH):

ef2af024464cc6e1c481d335c14672eccebc6fb0.pngapps.sentinel-hub.com
0d605cf007e70fef63de75e75f6672e960701301.jpg

Sentinel-hub EO-Browser3


Sentinel-2 L2A imagery taken on August 18, 2018


With the following settings


However, the file downloaded is only 571. KB (should be around 10-20MB), RGB 0-255 instead of single band 0-65535.


Do you know what could be wrong?

Also, I wanted to make sure that the image downloaded is Gamma0 orthorectified ?

(see https://docs.sentinel-hub.com/api/latest/#/data/Sentinel-1-GRD) If so, where can I find the documentation of the processing steps applied to the raw S1 imagery available in Scihub-copernicus please?

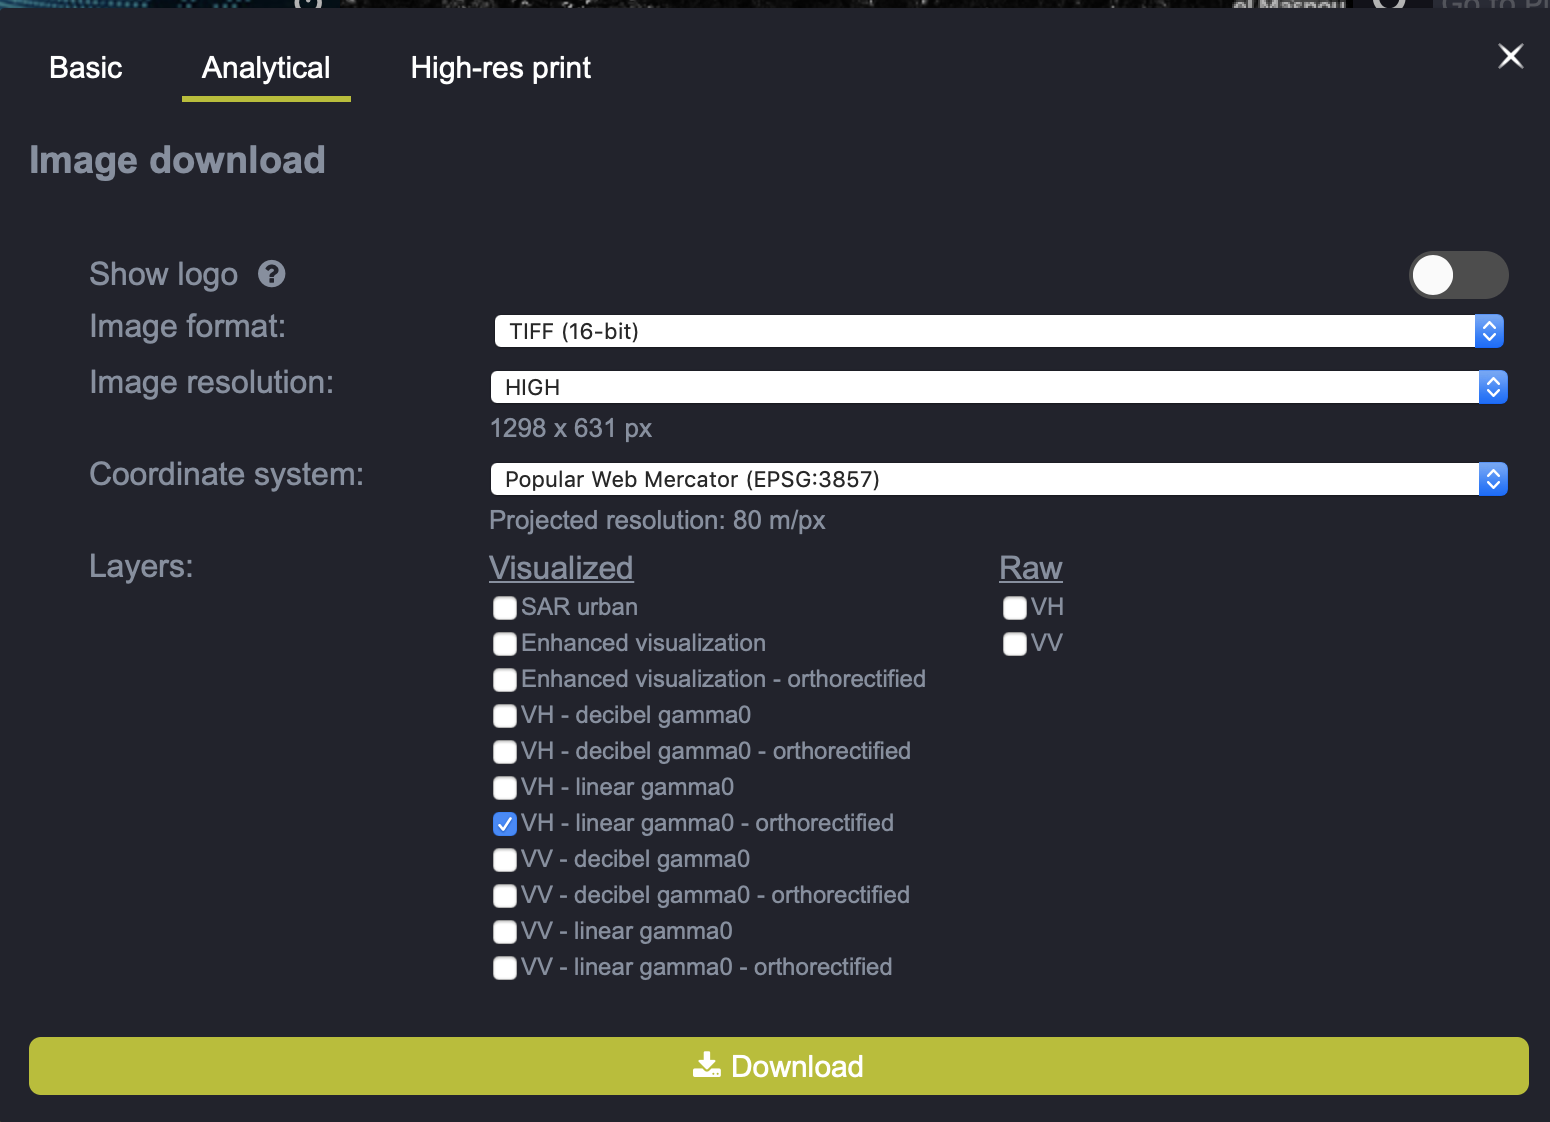
You have chosen “visualized” layer, which is why you get RGB. In order to get “raw values” you might have to set your own configuration in Configuration utility with appropriate parameters.


Under the Coordinate system line you will notice that projected resolution is 80m/px. I am guessing you are expecting 20 meter resolution? This would explain the difference in the expected size.

EO Browser allows exports up to 2500x2500 px. So you have to select a smaller area if you want to get higher resolution. For larger areas I would suggest you use sentinelhub-py’s Large area utilities:
https://sentinelhub-py.readthedocs.io/en/latest/examples/large_area_utilities.html


For information on S1 data I suggest you check:
https://docs.sentinel-hub.com/api/latest/#/data/Sentinel-1-GRD?id=sentinel-1-grd


I have to rewrite my deleted post, the edits were not uploading anymore. Here as it should be:

Greetings!
I would like to follow up with this topic. So, if I select VH - decibel gamm0-orthorectified from EO Browser Visualized as Tiff (16-bit), I will get values in the range from 0-65535. How I will get to the -20 -0 dB (or linear gamma range)? I doubt it is a linear stretch. What is Raw data? not orthorectified? And, are downloaded data thru EO Browser proper for scientific analysis? Or I need to download raw data from Copernicus hub and process them in e.g. SNAP to conduct scientific work?
Another thing, depending on the data location (EOCloud or AWS) under the Discover Tab , I will get the same image from those two data sources if available. But then, when downloading and selecting high resolution, data from EOCloud are at 10m spatial resolution (as it should be), but from AWS shows me 0.5m meters?
Thanks!


Hm…the only proper data type from available to get negative dB values looks to be Float32, but then values are in the range 0-1. Should next be linear stretch applied dlike ((value - min_value)*20/max_value ) -20] or any other data manipulation is needed, or maybe I just got it wrong?


Reply