Is it possible to read DN values of RS images in EO Browser, without scripting or external plugins (this is intended for unexperienced, young users)? If so, please, advise.

I am not sure what you mean “read DN values”.

If you export data as an “Analytical” option, you can select “raw bands”. There you will get a reflectance rather than DN, but these are closely related.

We will consider to allow an option to export DN data as well.


Thanks;

but to read DN (or reflectance) from downloaded raw bands I can’t do it in EO Browser but I need to use another program (eg. SNAP, MultiSpec etc.), isn’t it? The point is that I’d like to keep it as simple as possible, with an application of single, simple program, to be used by young, unexperienced college students, who will have only 2 or 3 lessons on RS.


Well, you would need QGIS.


But perhaps I am not understanding your need properly. What exactly would you like to do? What do you mean by “read DN”?


DN - Digital Number, the value of reflectance quantified to a range that depends on radiometric resolution, i.e. 0-255 for 8 bpp, 0-2048 for 11 bpp, etc.

You’re right, QGIS and many other programs can “read” it directly from image bands, but, it could be very good if EO Browser would do it too (as it allows for reading values from different band ratio or index images, e.g. NDVI).

Thanks, Grega again!


EO Browser can obviously read the DN as this is the inoput for all the processing you perform in EO Browser… To read values of NDVI, we read DN values of B08 and B04 and calculate NDVI…

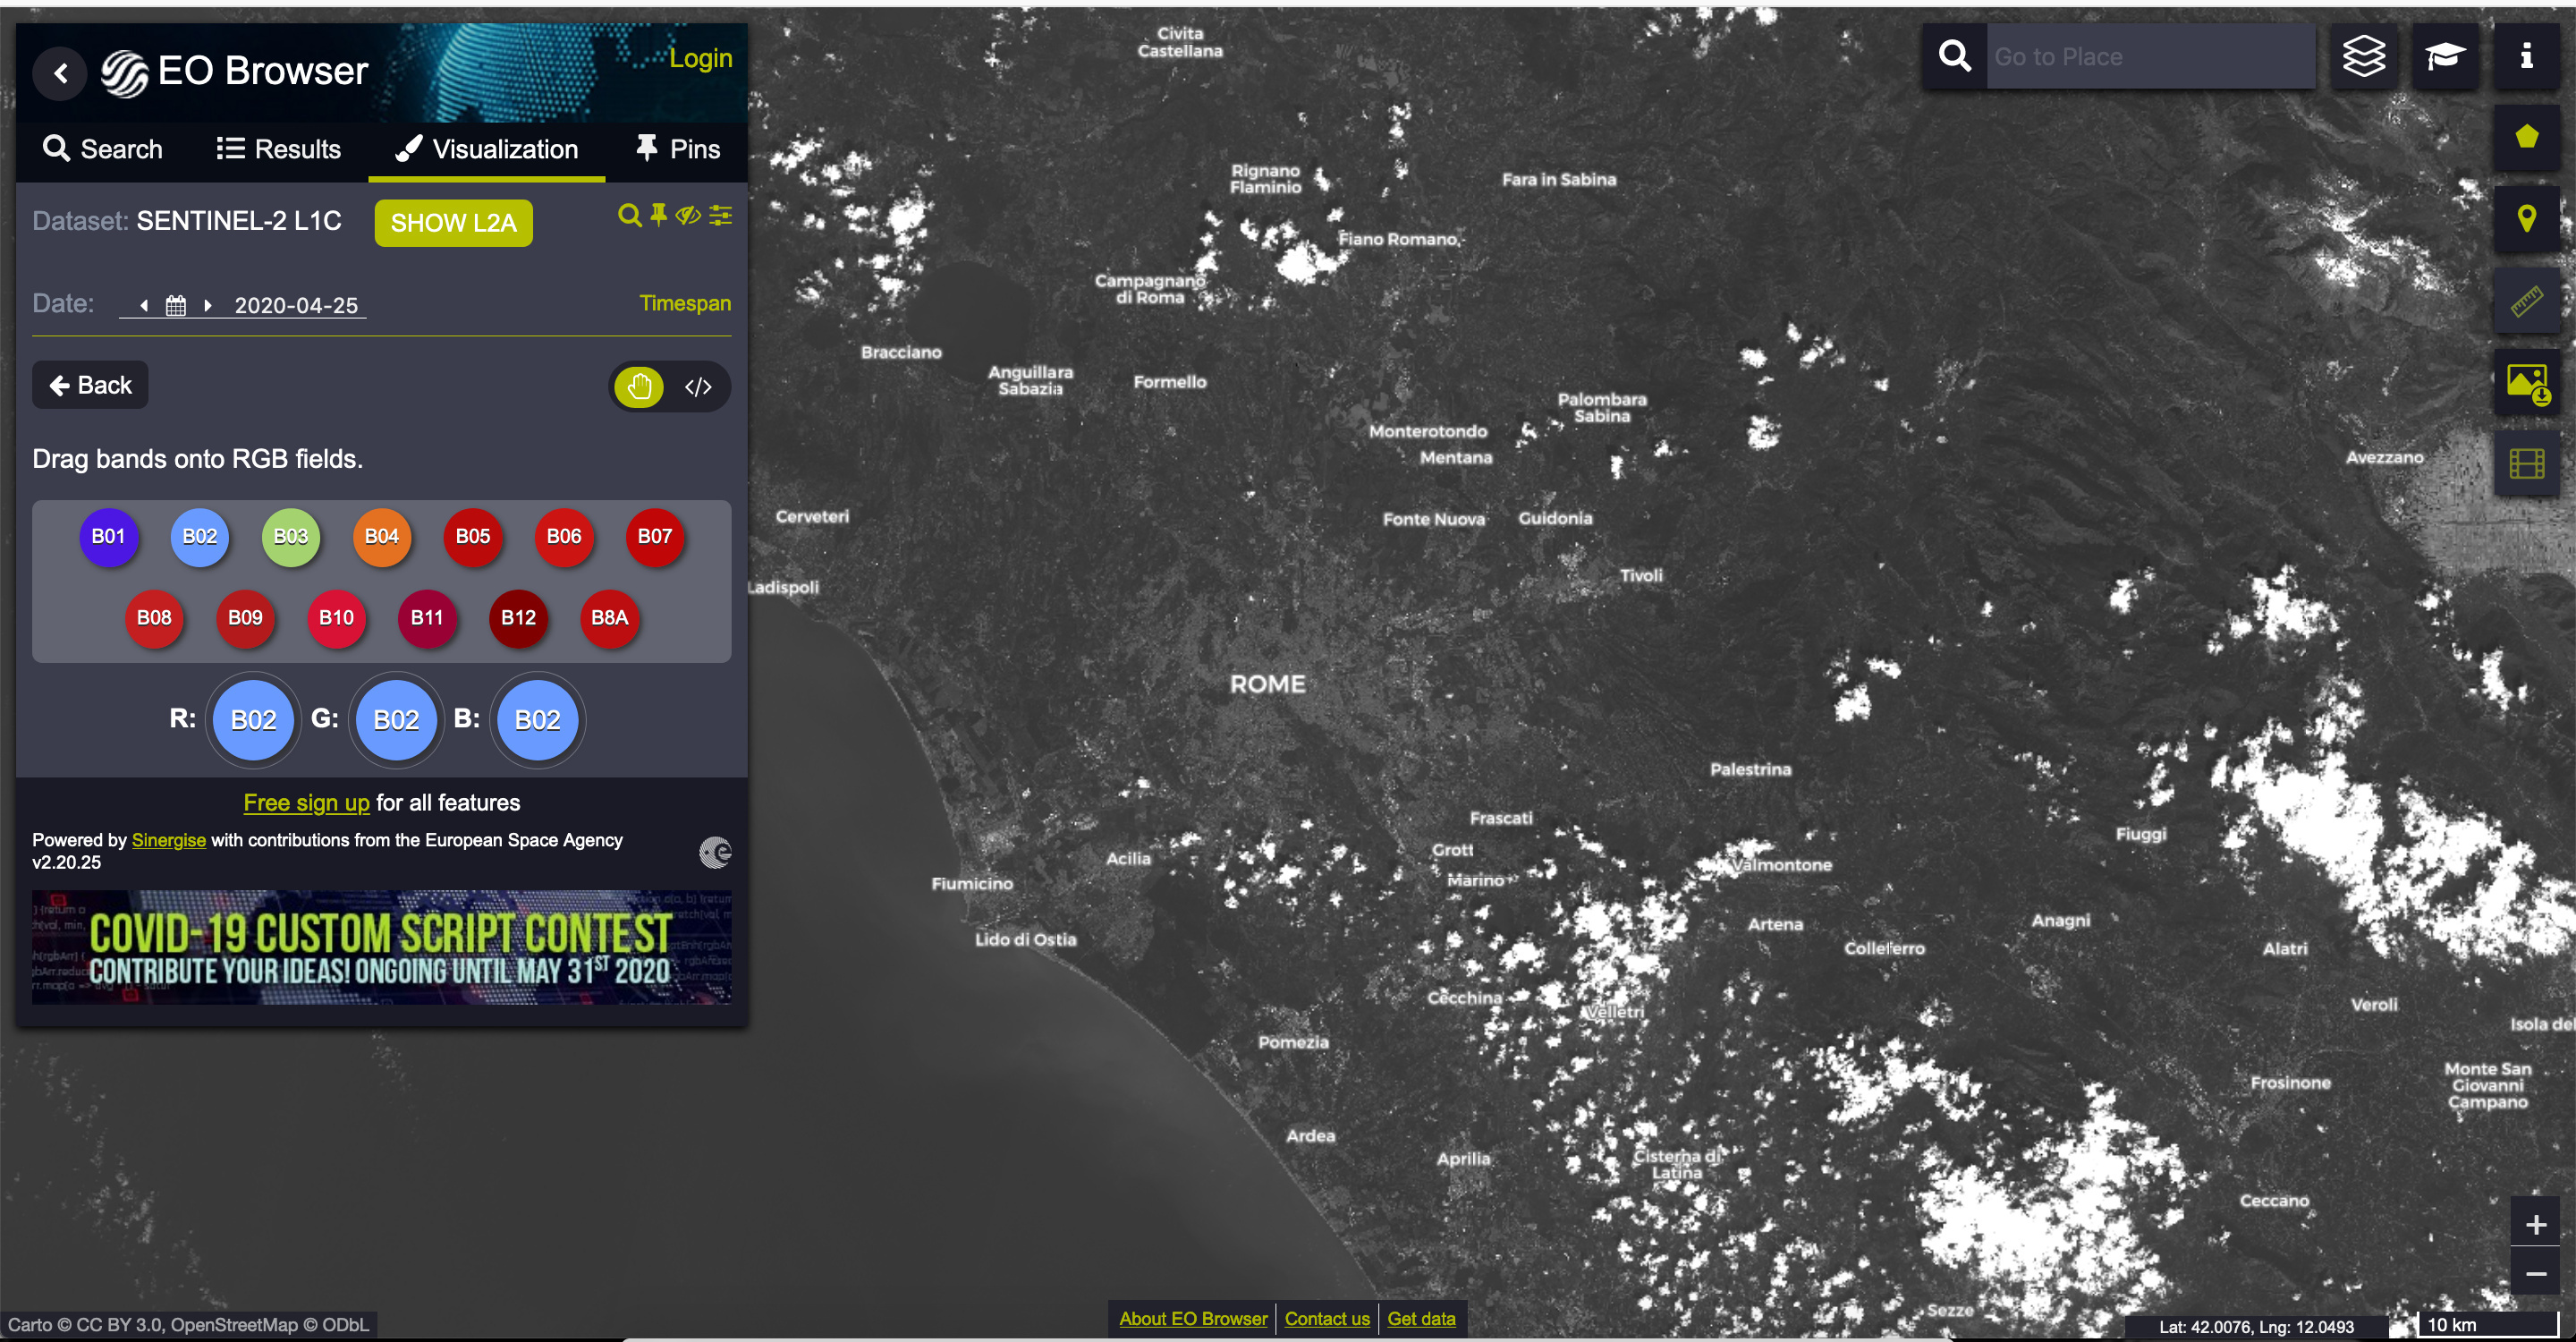
So if you simply want to visualise individual bands, it is as simple as choosing “Custom” visualization:


And then dragging the individual band to all three “channels” (Red, Green, Blue)


Thanks, Grega, this works (the same results from displaying a single band by putting a simple formula or “script” into script window)


Strangely enough I was thinking about this only this week to help me understand how to script custom functions. It would be really useful if there was an option for the digital values of pixels in the displayed bands to be reported (as numbers) at the position of the cursor(pointer).

Having to export to QGIS or similar adds a layer of complexity that is often above many in schools who can easily use the EO Browser.


Reply