
Hi,
I am interested in transforming the RGB bands of an S-1 image to better visualize the oil spills. For this I have found the following script that allows the ORM index to be visualized in the EO browser at https://custom-scripts.sentinel-hub.com /sentinel-1/orm_index/#.
Contains this:
//Oil slicks and Red tide monitoring
//By TIZNEGAR Startup Co, www.tiznegar.com
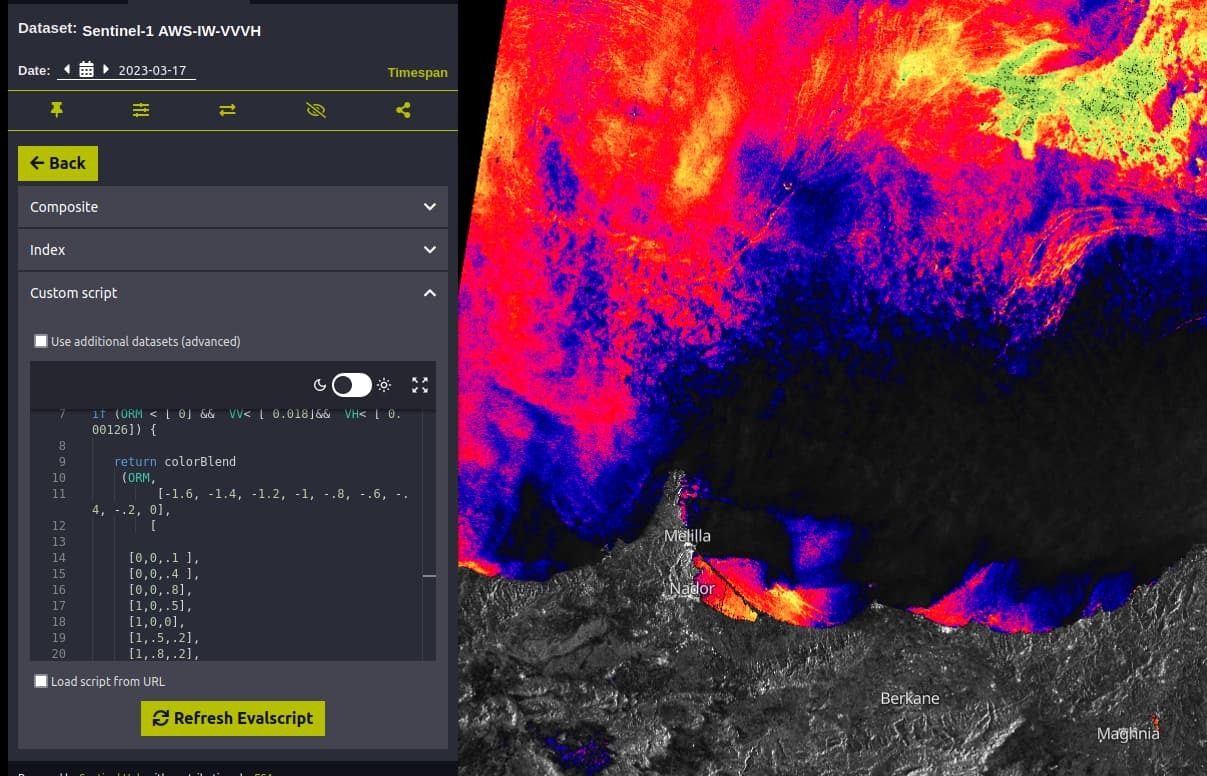
//Dataset:Sentinel-1 AWS-IW-VVVH
var ORM = Math.log(0.01/(0.01+VV*2));
if (ORM < [ 0] && VV< [ 0.018]&& VH< [ 0.00126]) {
return colorBlend
(ORM,
[-1.6, -1.4, -1.2, -1, -.8, -.6, -.4, -.2, 0],
[
[0,0,.1 ],
[0,0,.4 ],
[0,0,.8],
[1,0,.5],
[1,0,0],
[1,.5,.2],
[1,.8,.2],
[1,1,.4],
[.5,.8,.3],
]);
}
else {
return [2.5*VV,2.5*VV,2.5*VV]
}
If I want to use this code in python using the original VV and VH images from S-1. Between what values are the VV and VH that are evaluated through the EO browser (the original images are of the order of 0-6000) and how could I implement it in python using the original polarizations?
Thanks for the help
