Hi Tuomas,
Thanks for the question, we will try and find a solution for you. However, the QGIS plugin currently does not support WCS layers. Therefore, you can output the actual NDVI value from the plugin.
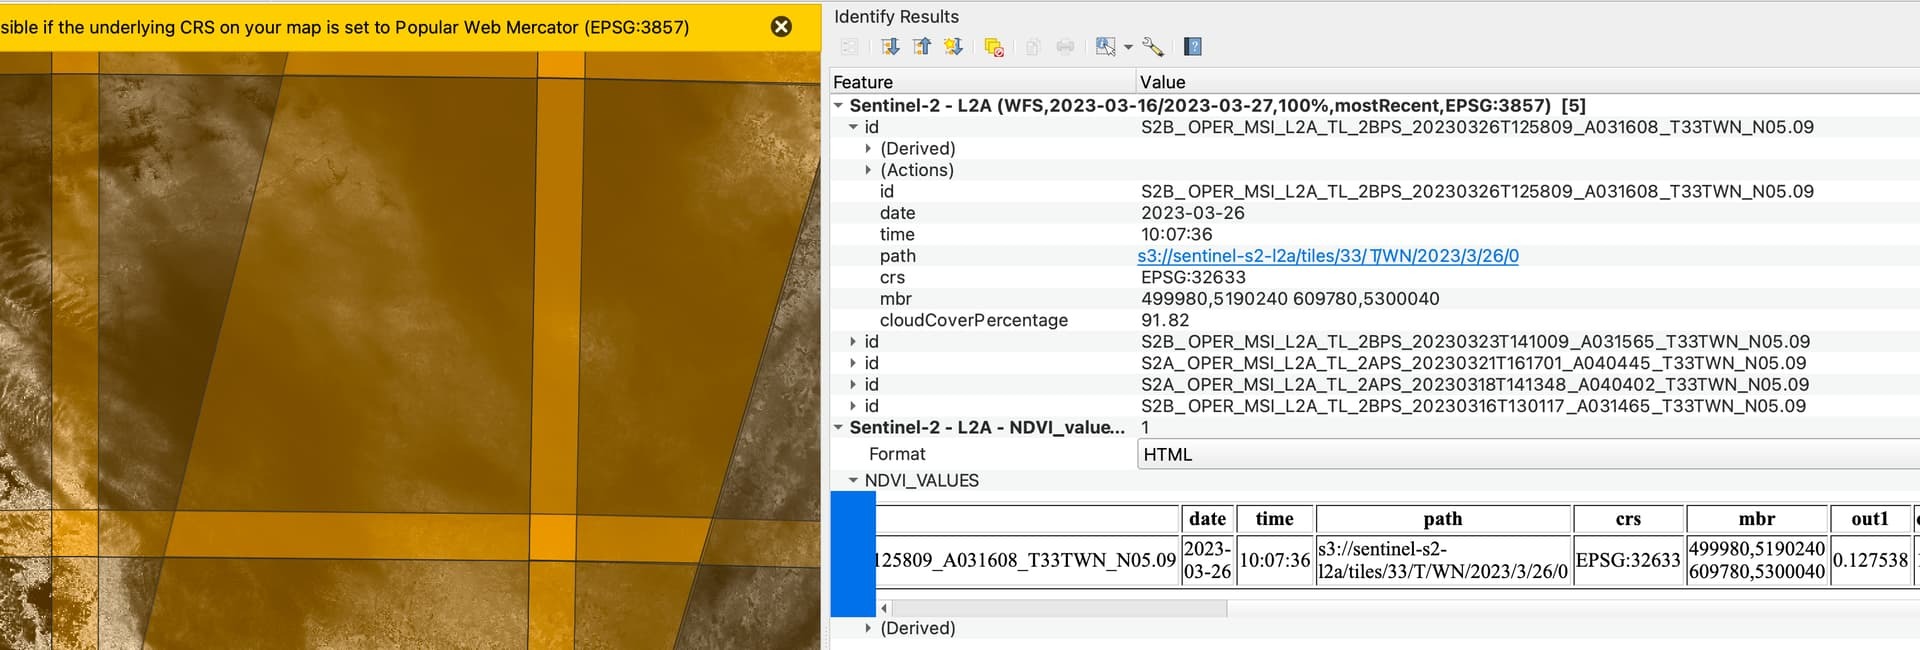
Separately, you can create an WFS layer that will enable you to obtain your cloud cover percentage too as screenshotted below:
In addition, I had trouble initially with your evalscript; to generate NDVI, I would recommend to update it to the same as the below:
//VERSION=3
function evaluatePixel(samples) {
let val = index(samples.B08, samples.B04);
return [val, samples.dataMask];
}
function setup() {
return {
input: [{
bands: [
"B04",
"B08",
"dataMask"
]
}],
output: {
bands: 2,
sampleType: "FLOAT32"
}
}
}
Please let me know if you need any more help or have other questions and I’ll be happy to help!
Thanks, I tried updating the script and now I can download the NDVI processes image, but cannot use the WMS to view it.
So choosing a date works, it shows cloud coverage, but when I choose “Create”, I get an empty WMS layer with no visualization options. However, if I download the data, it is shown correctly as a tiff, with the range going from -0,1 to 0.94.
Meanwhile, the “Simple WMS template” NDVI works, but if I change the visualization there to the same code presented above, I get a grayscale version of the data as a WMS, but I’m unable to change the visualization, it is just grayscale. If I then download that data, it goes from 0 to 214.
This seems like a simple thing, but somehow I cannot get it right:
- navigating to a site, checking for suitable imagery
- clip or download the NDVI indexes for the field
- classify the visualization and use QGIS to analyze parts of the field
Your reply helped in skipping the download of B8 and B4 separately, thanks! So it’s now more streamlined, although not perfect.
Hi Tuomas,
Yes, the example I have given you enables you to download the NDVI with the “real” index values (0 to 1). In contrast, the NDVI in the Simple WMS template is only a visualisation. This uses UINT8 RGB values to create a visually attractive image. However, the values are not the NDVI values.
A solution for you could be to create two layers in your configuration. One layer for visualising the data, and a second layer to be used to download the actual values.
I hope that this solution helps you out, if you need some more guidance we will be here to guide you along