Hello,


I am trying to access S1 data for multiple dates. Our AOIs are anywhere between 50 sq. km. to 500 sq.km. As told by SH team, we are using Process API to access it. I have a couple of questions related the API.


  • I was able to specify resolution parameter in the api request. Here is what my code looks like in Python. Notice that I am specifying resolution for S1 data which may not be the best idea. But I was not sure how to get IW - high res data otherwise.

       data_folder='data',
evalscript=evalscript_all_bands,
input_data=[
SentinelHubRequest.input_data(
data_collection=DataCollection.SENTINEL1_IW,
time_interval=(start, end), // Single day based on catalog data
other_args={
"processing": {"orthorectify": True, "backCoeff": "GAMMA0_TERRAIN", "upsampling": "NEAREST", }}
)],
responses=[
SentinelHubRequest.output_response('default', MimeType.TIFF)
],
geometry=aoi, // using split geometry capabilities to split a large area into smalller areas
resolution=(10, 10),
config=config
)

My eval script looks like this:


//VERSION = 3
function setup() {
return {
input: ["VH"],
output: { id:"default", bands: 1}
}}
function evaluatePixel(samples) {
return [2 * samples.VH]
}

Does this look ok?


  • I also noticed that when I execute the request using all_bands_img = response.get_data(save_data=True) the saved files only says response.tif. If I want to merge various tiles into a single tiff later, how do I find out which tile belongs where? Is there an identifier for the date or something that I can use?


  • What is the largest area/size process API can handle?


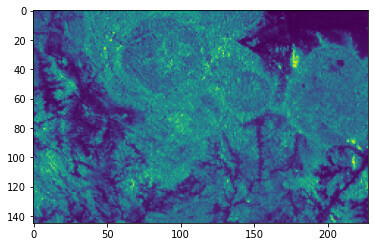
Also, when I run the code, all images come back blank (0 values).


Yes, in general your requests seem ok.


Regarding resolution: there is a utility function in sentinelhub, called bbox_to_dimensions, which is useful to calculate the size for the SentinelHubRequest input parameter, when one is dealing with bounding boxes. In case of geometries, the specification as you have done, with resolution as a parameter, is the right way to go. The (10, 10) is indeed “questionable” in case of S-1, but you could also specify some other value. NB, that resolution is in crs units, so best that your geometries and bounding boxes are in UTM.


Regarding the cached data: each request is saved in its own folder, where folder name is a hash of the request. In there you should find (in your case) a response.tiff, which corresponds to the default output. You will also find in the folder of each request a request.json, which is a payload that has been sent to SH service, containing your bbox/geometry and timestamps. The response.tiff is a (multi band) tiff file that has all the bands that have been requested. In case of several outputs, the response iz a .tar file, and tiffs in that tar file will have names according to your output identificators in the request.


ProcessAPI is limited to 2500x2500 pixels.


Please find a minimal working example here, although this one requests most recent data from May 2021:


from sentinelhub import BBox, CRS, MimeType, SentinelHubRequest, DataCollection, bbox_to_dimensions
import matplotlib.pyplot as plt

test_bb = BBox((8.345490,18.634534,9.210663,19.160735), crs=CRS.WGS84)

evalscript = """
//VERSION = 3
function setup() {
return {
input: u"VV"],
output: {
id:"default",
bands: 1
}
}}
function evaluatePixel(samples) {
return u2 * samples.VV]
}
"""

req = SentinelHubRequest(
data_folder='tt_data',
evalscript=evalscript,
input_data=a
SentinelHubRequest.input_data(
data_collection=DataCollection.SENTINEL1_IW,
time_interval=('2021-05-01','2021-06-01'),
mosaicking_order='mostRecent',
other_args={
"processing": {
"orthorectify": True,
"backCoeff": "GAMMA0_TERRAIN",
"upsampling": "NEAREST"
}
}
)
],
responses=s
SentinelHubRequest.output_response('default', MimeType.TIFF)
],
bbox=test_bb,
size=bbox_to_dimensions(test_bb, 400)
)

d = req.get_data(save_data=True)r0]

plt.imshow(d)

s1_mwe


Reply