
Hi Team!

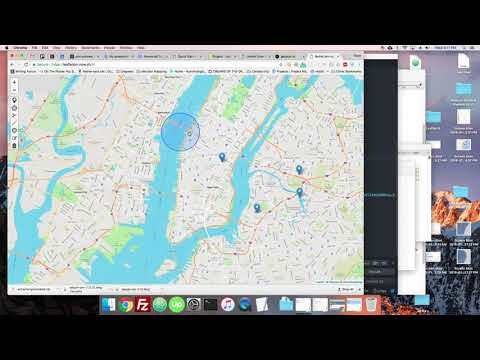
I am developing a simple web application that I would be able to extract NDVI values for my area of interest. My area of interest will have to be input / entered by either drawing a polygon or importing a shapefile. I am looking for ways to possibly do so. I will appreciate any assistance. Below is my code.


Thanks!


#map{

width: 100vw;

height: 100vh;

}


    <link rel="stylesheet" href="https://unpkg.com/@geoman-io/leaflet-geoman-free@latest/dist/leaflet-geoman.css" />
<script src="https://unpkg.com/@geoman-io/leaflet-geoman-free@latest/dist/leaflet-geoman.min.js"></script>

</head>
</body>

<div id="map"></div>

<script>
/*************************

!!! EVERYTHING ABOVE THIS IS AN ASSUMPTION !!!
Because Markdown treats html tags as formatting if they are not encapsed with triple ` (backtick)).
Also, I added just the <link ...> and <script src="..." /> tags for Leaflet.

# Sentinel Hub OAuth2 + Process API Leaflet

How to use:

1) enter sentinelHubNDVI client ID and secret
(go to SH Dashboard -> User settings -> OAuth clients -> "+")

2) open this file in browser

*************************/
const CLIENT_ID = "369d8442-020e-40ee-Hidden";
const CLIENT_SECRET = "L+m5(5/)%U/6Hidden";

const fromDate = "2020-07-01T00:00:00.000Z";
const toDate = "2021-05-01T00:00:00.000Z";
const dataset = "S2L1C";
const evalscript = `//VERSION=3
//This script was converted from v1 to v3 using the converter API

//NDVI EVALSCRIPT

if (dataMask == 0) return [0,0,0,0];

//ndvi
var val = (B08-B04)/(B08+B04);

if (val<-1.1) return [0,0,0,1];
else if (val<-0.2) return [0.75,0.75,0.75,1];
else if (val<-0.1) return [0.86,0.86,0.86,1];
else if (val<0) return [1,1,0.88,1];
else if (val<0.025) return [1,0.98,0.8,1];
else if (val<0.05) return [0.93,0.91,0.71,1];
else if (val<0.075) return [0.87,0.85,0.61,1];
else if (val<0.1) return [0.8,0.78,0.51,1];
else if (val<0.125) return [0.74,0.72,0.42,1];
else if (val<0.15) return [0.69,0.76,0.38,1];
else if (val<0.175) return [0.64,0.8,0.35,1];
else if (val<0.2) return [0.57,0.75,0.32,1];
else if (val<0.25) return [0.5,0.7,0.28,1];
else if (val<0.3) return [0.44,0.64,0.25,1];
else if (val<0.35) return [0.38,0.59,0.21,1];
else if (val<0.4) return [0.31,0.54,0.18,1];
else if (val<0.45) return [0.25,0.49,0.14,1];
else if (val<0.5) return [0.19,0.43,0.1972,1];
else if (val<0.55) return [0.13,0.38,0.07,1];
else if (val<0.6) return [0.06,0.33,0.04,1];
else return [0,0.27,0,1];
`;

const evalscript1 = `//VERSION=3
//TRUE COLOR

let minVal = 0.0;
let maxVal = 0.4;

let viz = new HighlightCompressVisualizer(minVal, maxVal);

function evaluatePixel(samples) {
let val = [samples.B04, samples.B03, samples.B02];
val = viz.processList(val);
val.push(samples.dataMask);
return val;
}

function setup() {
return {
input: [{
bands: [
"B02",
"B03",
"B04",
"dataMask"
]
}],
output: {
bands: 4
}
}
}
`;

// Promise which will fetch Sentinel Hub authentication token:
const authTokenPromise = fetch(
"https://services.sentinel-hub.com/oauth/token",
{
method: "post",
headers: { "Content-Type": "application/x-www-form-urlencoded" },
body: `grant_type=client_credentials&client_id=${encodeURIComponent(
CLIENT_ID
)}&client_secret=${encodeURIComponent(CLIENT_SECRET)}`,
}
)
.then((response) => response.json())
.then((auth) => auth["access_token"]);

// We need to extend Leaflet's GridLayer to add support for loading images through
// Sentinel Hub Process API:
L.GridLayer.SHProcessLayer = L.GridLayer.extend({
createTile: function (coords, done) {
const tile = L.DomUtil.create("img", "leaflet-tile");
const tileSize = this.options.tileSize;
tile.width = tileSize;
tile.height = tileSize;
const nwPoint = coords.multiplyBy(tileSize);
const sePoint = nwPoint.add([tileSize, tileSize]);
const nw = L.CRS.EPSG4326.project(
this._map.unproject(nwPoint, coords.z)
);
const se = L.CRS.EPSG4326.project(
this._map.unproject(sePoint, coords.z)
);

authTokenPromise.then((authToken) => {
// Construct Process API request payload:
// https://docs.sentinel-hub.com/api/latest/reference/#tag/process
const payload = {
input: {
bounds: {
bbox: [nw.x, nw.y, se.x, se.y], // a tile's bounding box
geometry: { // remove to disable clipping
type: "Polygon",
coordinates: [
[
[
-0.373367,
35.742975
],
[
-0.373412,
35.742907
],
[
-0.373316,
35.742966
],
[
-0.373404,
35.742977
],
[
-0.383367,
35.752975
]
]
]
},
properties: {
crs: "http://www.opengis.net/def/crs/EPSG/0/4326",
},
},
data: [
{
dataFilter: {
timeRange: {
from: fromDate,
to: toDate,
},
maxCloudCoverage: 10,
mosaickingOrder: "mostRecent",
},
processing: {},
type: dataset,
},
],
},
output: {
width: 512,
height: 512,
responses: [
{
identifier: "default",
format: {
type: "image/png",
},
},
],
},
evalscript: this.options.evalscript, // CHANGED: using the evalscript that was passed
};

// Fetch the image:
fetch("https://services.sentinel-hub.com/api/v1/process", {
method: "post",
headers: {
Authorization: "Bearer " + authToken,
"Content-Type": "application/json",
Accept: "*/*",
},
body: JSON.stringify(payload),
})
.then((response) => response.blob())
.then((blob) => {
const objectURL = URL.createObjectURL(blob);
tile.onload = () => {
URL.revokeObjectURL(objectURL);
done(null, tile);
};
tile.src = objectURL;
})
.catch((err) => done(err, null));
});
return tile;
},
});

L.gridLayer.shProcessLayer = function (opts) {
return new L.GridLayer.SHProcessLayer(opts);
};

// CHANGED: passed the object with the correct evalscript to the L.gridLayer.shProcessLayer
const sentinelHubNDVI = L.gridLayer.shProcessLayer({evalscript: evalscript});
const sentinelHubTrueColor = L.gridLayer.shProcessLayer({evalscript: evalscript1});

// OpenStreetMap layer:
let osm = L.tileLayer("http://{s}.tile.osm.org/{z}/{x}/{y}.png", {
attribution: '&copy; <a href="http://osm.org/copyright">OpenStreetMap</a> contributors'
});
// http://{s}.tile.osm.org/{z}/{x}/{y}.png

// configure Leaflet:
let baseMaps = {
OpenStreetMap: osm,
};
let overlayMaps = {
"NDVI": sentinelHubNDVI,
"True": sentinelHubTrueColor,
};

let map = L.map("map", {
center: [-0.373467, 35.742575], // lat/lng in EPSG:4326
zoom: 15,
layers: [osm, sentinelHubNDVI],
});
L.control.layers(baseMaps, overlayMaps).addTo(map);
L.marker([51.50915, -0.096112], { pmIgnore: false }).addTo(map);
</script>
</body>
</html>

Hello!


Since you’re using Leaflet, Leaflet Draw would be a great choice for drawing polygons.


They have quite a bit of documentation available on this page: Leaflet Draw Documentation


This tutorial does a great job at explaining how you get up and running with it in 8 minutes.


When it comes to importing shapefiles, this is a good choice.

favicon.svgGitHub
71fb0ab083a511669d6e1bbddf9db8298bcba61f.png


GitHub - calvinmetcalf/leaflet.shapefile: Shapefile in Leaflet


Shapefile in Leaflet. Contribute to calvinmetcalf/leaflet.shapefile development by creating an account on GitHub.


Let me know if you need any further assistance!


// Pontus


Hey @pontus.berg and thanks for your great assistance. I did finally manage to add the drawing tools, however, it has been struggle trying to add the shapefile plugin, and haven’t been successful. Could there be something that would guide me step by step? And another thing is that I would like once someone draws a polygon, NDVI of the area under study is generated and shown as a graph/chart. Is there a way I could also implement that? I have added the code below for the listening events for drawing the polygon, but I haven’t gotten it to work.

I will appreciate your assistance!


<script>


const CLIENT_ID = "369d8442-020e-40ee-Hidden";

const CLIENT_SECRET = "L+m5(5/)%U/6Hidden";

const fromDate = "2020-07-01T00:00:00.000Z";

const toDate = "2021-05-01T00:00:00.000Z";

const dataset = "S2L1C";

const evalscript = `//VERSION=3

//This script was converted from v1 to v3 using the converter API

//NDVI EVALSCRIPT

if (dataMask == 0) return u0,0,0,0];

//ndvi

var val = (B08-B04)/(B08+B04);

if (val<-1.1) return u0,0,0,1];

else if (val<-0.2) return u0.75,0.75,0.75,1];

else if (val<-0.1) return u0.86,0.86,0.86,1];

else if (val<0) return u1,1,0.88,1];

else if (val<0.025) return u1,0.98,0.8,1];

else if (val<0.05) return u0.93,0.91,0.71,1];

else if (val<0.075) return u0.87,0.85,0.61,1];

else if (val<0.1) return u0.8,0.78,0.51,1];

else if (val<0.125) return u0.74,0.72,0.42,1];

else if (val<0.15) return u0.69,0.76,0.38,1];

else if (val<0.175) return u0.64,0.8,0.35,1];

else if (val<0.2) return u0.57,0.75,0.32,1];

else if (val<0.25) return u0.5,0.7,0.28,1];

else if (val<0.3) return u0.44,0.64,0.25,1];

else if (val<0.35) return u0.38,0.59,0.21,1];

else if (val<0.4) return u0.31,0.54,0.18,1];

else if (val<0.45) return u0.25,0.49,0.14,1];

else if (val<0.5) return u0.19,0.43,0.11,1];

else if (val<0.55) return u0.13,0.38,0.07,1];

else if (val<0.6) return u0.06,0.33,0.04,1];

else return u0,0.27,0,1];

`;

const evalscript1 = `//VERSION=3

//TRUE COLOR

let minVal = 0.0;

let maxVal = 0.4;

let viz = new HighlightCompressVisualizer(minVal, maxVal);

function evaluatePixel(samples) {

let val = lsamples.B04, samples.B03, samples.B02];

val = viz.processList(val);

val.push(samples.dataMask);

return val;

}

function setup() {

return {

input: u{

bands: d

"B02",

"B03",

"B04",

"dataMask"

]

}],

output: {

bands: 4

}

}

}

`;

// Promise which will fetch Sentinel Hub authentication token:

const authTokenPromise = fetch(

"https://services.sentinel-hub.com/oauth/token",

{

method: "post",

headers: { "Content-Type": "application/x-www-form-urlencoded" },

body: `grant_type=client_credentials&client_id=${encodeURIComponent(

CLIENT_ID

)}&client_secret=${encodeURIComponent(CLIENT_SECRET)}`,

}

)

.then((response) => response.json())

.then((auth) => autha"access_token"]);

// We need to extend Leaflet's GridLayer to add support for loading images through

// Sentinel Hub Process API:

L.GridLayer.SHProcessLayer = L.GridLayer.extend({

createTile: function (coords, done) {

const tile = L.DomUtil.create("img", "leaflet-tile");

const tileSize = this.options.tileSize;

tile.width = tileSize;

tile.height = tileSize;

const nwPoint = coords.multiplyBy(tileSize);

const sePoint = nwPoint.add(atileSize, tileSize]);

const nw = L.CRS.EPSG4326.project(

this._map.unproject(nwPoint, coords.z)

);

const se = L.CRS.EPSG4326.project(

this._map.unproject(sePoint, coords.z)

);

authTokenPromise.then((authToken) => {

// Construct Process API request payload:

// https://docs.sentinel-hub.com/api/latest/reference/#tag/process

const payload = {

input: {

bounds: {

bbox: onw.x, nw.y, se.x, se.y], // a tile's bounding box

geometry: { // remove to disable clipping

type: "Polygon",

coordinates: e


-0.373367,

35.742975

],


-0.373412,

35.742907

],


-0.373316,

35.742966

],


-0.373404,

35.742977

],


-0.383367,

35.752975

]

]

]

},

properties: {

crs: "http://www.opengis.net/def/crs/EPSG/0/4326",

},

},

data: t

{

dataFilter: {

timeRange: {

from: fromDate,

to: toDate,

},

maxCloudCoverage: 10,

mosaickingOrder: "mostRecent",

},

processing: {},

type: dataset,

},

],

},

output: {

width: 512,

height: 512,

responses: e

{

identifier: "default",

format: {

type: "image/png",

},

},

],

},

evalscript: this.options.evalscript, // CHANGED: using the evalscript that was passed

};

// Fetch the image:

fetch("https://services.sentinel-hub.com/api/v1/process", {

method: "post",

headers: {

Authorization: "Bearer " + authToken,

"Content-Type": "application/json",

Accept: "*/*",

},

body: JSON.stringify(payload),

})

.then((response) => response.blob())

.then((blob) => {

const objectURL = URL.createObjectURL(blob);

tile.onload = () => {

URL.revokeObjectURL(objectURL);

done(null, tile);

};

tile.src = objectURL;

})

.catch((err) => done(err, null));

});

return tile;

},

});

L.gridLayer.shProcessLayer = function (opts) {

return new L.GridLayer.SHProcessLayer(opts);

};

// CHANGED: passed the object with the correct evalscript to the L.gridLayer.shProcessLayer

const sentinelHubNDVI = L.gridLayer.shProcessLayer({evalscript: evalscript});

const sentinelHubTrueColor = L.gridLayer.shProcessLayer({evalscript: evalscript1});


// OpenStreetMap layer:

let osm = L.tileLayer("http://{s}.tile.osm.org/{z}/{x}/{y}.png", {

attribution: '&copy; <a href="http://osm.org/copyright">OpenStreetMap</a> contributors'

});

// http://{s}.tile.osm.org/{z}/{x}/{y}.png


// configure Leaflet:

let baseMaps = {

OpenStreetMap: osm,

};

let overlayMaps = {

"NDVI": sentinelHubNDVI,

"True": sentinelHubTrueColor,

};

let map = L.map("map", {

center: e-0.373467, 35.742575], // lat/lng in EPSG:4326

zoom: 15,

layers: rosm, sentinelHubNDVI],

});

L.control.layers(baseMaps, overlayMaps).addTo(map);

// add leaflet-geoman controls with some options to the map

map.pm.addControls({

position: 'topleft',

// drawPolygon: true,

});

// listen to vertexes being added to currently drawn layer (called workingLayer)

map.on('pm:drawstart', ({ workingLayer }) => {

workingLayer.on('pm:create', e => {

console.log(e);

});

});

'use strict';

</script>

Hey again!


Take a look at this post. It has some more detailed information of how to upload shape files to leaflet. javascript - Display shapeFile on leaflet map using an uploaded file.zip - Stack Overflow


For creating charts you can use the histogram feature of our statistical API. We have documentation and examples available on this page .

59b509d2bc7045de114394118c5b4a7504ffbbf1.pngsentinel-hub.com
d3714e73b38a87afa3c31502a6696052a7395163.png


FIS - DEPRECATED


The Statistical Info API (FIS), performed elementary statistical computations on remotely sensed data. It has been deprecated, as we developed a new powerful Statistical API.


I have added the code below for the listening events for drawing the polygon, but I haven’t gotten it to work.


Do you get some kind of error message here?


Best regards

Pontus


Reply