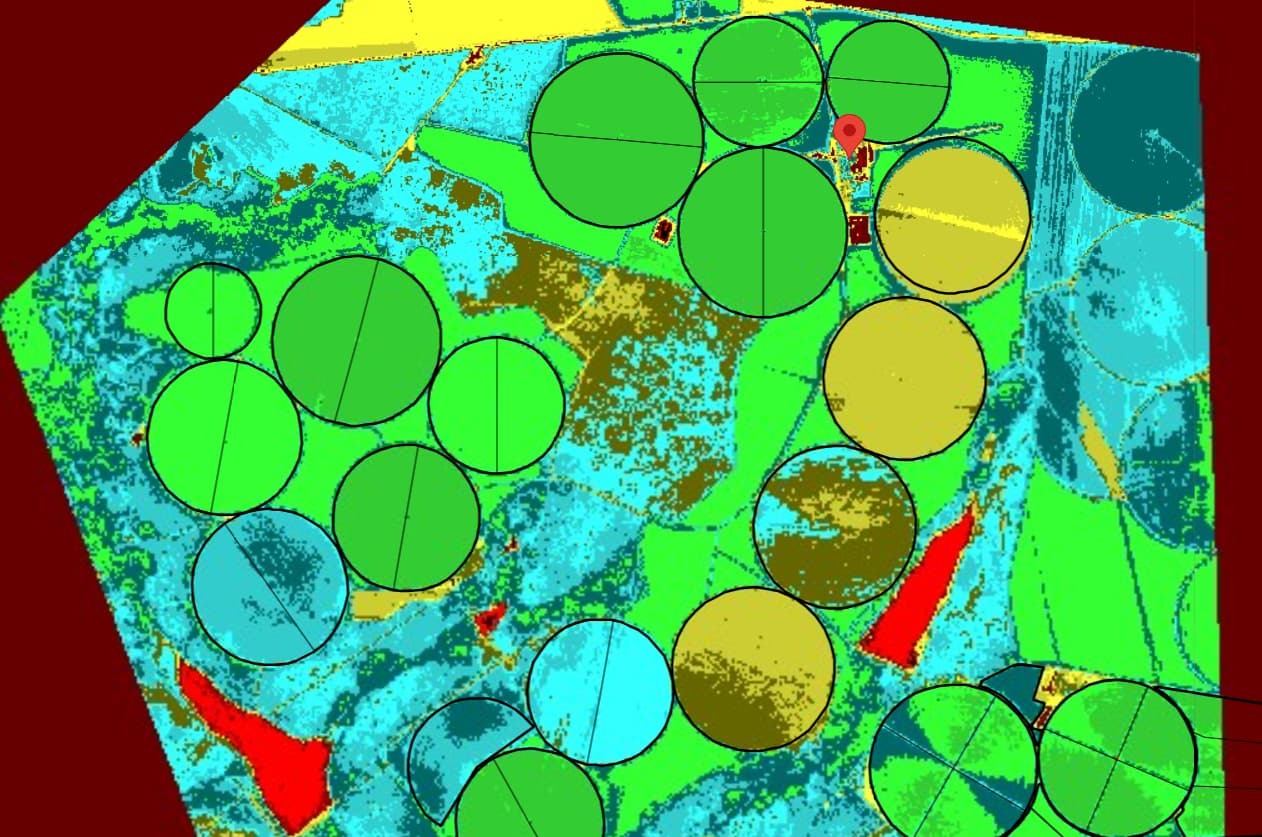
Hello, I’m developing an NDVI view based on sentinel data.
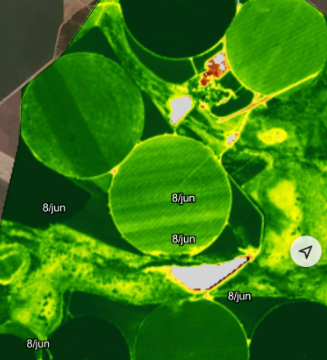
I pulled the data according to the NDVI provided by the platform and the image is the first one, but I wanted something similar to this other solution below.
I know she also uses Sentinel, but I believe I do another calculation between the bands, could someone help me calculate to get something similar?