Hi @p.maurischat ,
Could you please provide us the catchment geometry which failed to get the statistics?
Here is the basic polygon:
{"type":"Polygon","coordinates":[[[-85.267639,41.97426],[-85.267639,42.397354],[-84.218445,42.397354],[-84.218445,41.97426],[-85.267639,41.97426]]]}
The two dates (dd.mm.yyyy) I was requesting were:
21.07.2022
14.09.2022
The Multipolygon catchment kmz, I can not upload because I am a “new user”, sorry
Hi @p.maurischat ,
I requested Sentinel-2 NDVI statistics with your basic polygon and it worked even with 5 years of data (it take time to get the response though). Does the basic polygon work for you?
Could you please provide your catchment Multipolygon in the WKT format? Then I can investigate if it is the same Multipolygon issue as the one mentioned in the other thread. Thank you!
Hi, interesting… it doesnt work for me, even with the basic polygon. i tried today at another PC with a colleagues account and also there it did not work.
I Always get a notice “Request failed with status code 400” after a certain amount of time ~roughly 30 sec.
Hi @p.maurischat ,
Could you please let us know which version of EO Browser you are using (you can find the version number in the bottom of the sidebar and it should say v3.46.1).
Can you please also share the URL with us that causes the problem? It would also help us to get a more detailed step by step instruction of where you are experiencing the problem.
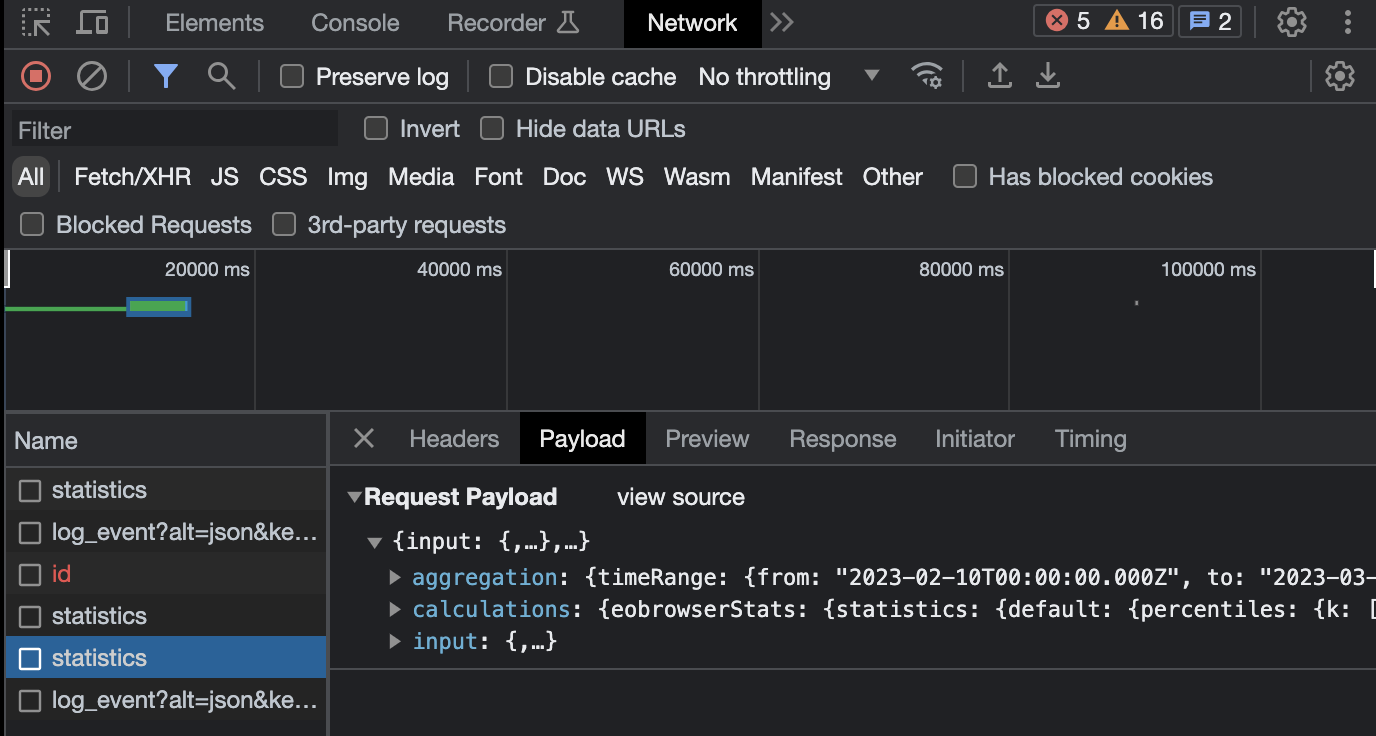
Also, please try to open the developer tools (in Chrome View → Developer → Developer Tools) and go the Network tab, then click the statistics info button. You should be seeing a “statistics” pop out in the “Name” column on the left. Please click it, inspect the columns on the right, e.g., headers, payload, response, etc., and let us know if there’s an error message (Fig 1).
Fig 1
Hi,
the version is updated (v3.46.1) as should be.
The following URL shows during the problem:
Sentinel Hub EO Browser
The problem is created after uploading the catchment delineations /or/ selecting the rectangle area of interest, I then select the “Statistical info, Feature info service chart” icon from the top right pop out bar (the icon looks like: barplots in a grid). After having done this a pop-up window opens indicating the calculating is in progress (“Loading, please wait”) after roughly 30-60 secs. The operation terminates and the the error message is shown (“Request failed with status code 400”)
<<
This is what I got from the dev tool console:
Failed to load resource: the server responded with a status of 403 ()
main.f3b03c57.chunk.js:1 Error: Request failed with status code 403
Error with Permissions-Policy header: Unrecognized feature: ‘ch-ua-form-factor’.
vnSLr707jE0:1 pIntervention] Slow network is detected.
Hi @p.maurischat ,
With the url you provided I can reproduce the error Request failed with status code 400
. However, I’m not sure if this is the same error you encountered as I got 400 common bad request instead of 403.
The request failed because of the area you are requesting is too large for Sentinel-2 L1C, which leads to a request at 1490 meter per pixel. Sentinel Hub API is optimised for full resolution data access as this is what most users need. For Sentinel-2 L1C, the lowest option you can reach with the default option is 200 meter per pixel (see the documentation for more details). I am investigating if there is a way to configure a layer with previewMode: "PREVIEW"
. Meanwhile, the workaround would be using the Sentinel-2 L2A as it does not have this limitation and you can request data from full-resolution to 1500 meter per pixel.
This topic was automatically closed 60 days after the last reply. New replies are no longer allowed.