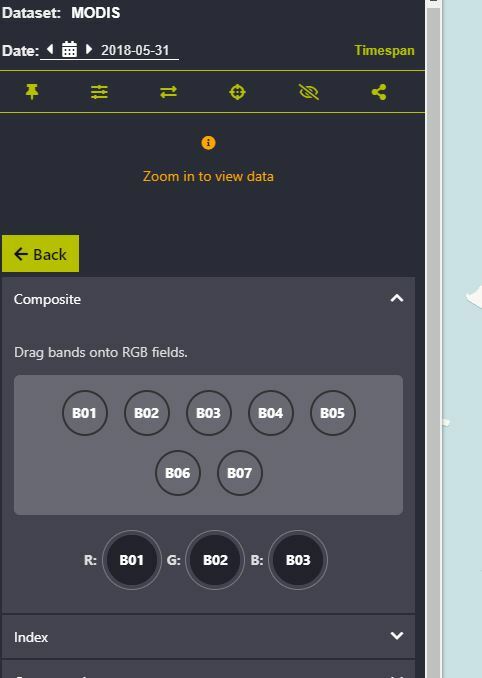
Respected Sir/Ma’am,
I am looking for Soil moisture, soil composition, or soil wetness index for four counties in Alaska. I want a monthly average starting from May 2018 – till the current. I am looking for a 500meters higher resolution. I looked for Sentinel 2 and Landsat8 scripts and over EO but for one month they do not cover the whole area. I was going through the Index database for soil-related datasets where Modis was mentioned for most of the soil-related products.
After looking at the EO browser for data availability for each month for the study area MODIS could be an option. I have worked upon this script so far but I expected the values to between 0 - 0.4 or maybe a bit higher. I just need one band in the final product, with less than 5% cloud cover and, monthly averages.
Here is the script:
curl -X POST https://services-uswest2.sentinel-hub.com/api/v1/process
-H ‘Content-Type: application/json’
-H 'Authorization: Bearer my-token
-d ‘{
“input”: {
“bounds”: {
“geometry”: {
“type”: “Polygon”,
“coordinates”: [
[
[
-17325124.285874,
10164099.147192
],
[
-17840351.261375,
9942081.014397
],
[
-17856693.817134,
9406315.992829
],
[
-17945241.746287,
9123241.101054
],
[
-17996301.27797,
8741174.216142
],
[
-15666493.37151,
8789581.808807
],
[
-15632807.824716,
10626689.308241
],
[
-17344303.465751,
10479247.243331
],
[
-17325124.285874,
10164099.147192
]
]
]
},
“properties”: {
“crs”: “http://www.opengis.net/def/crs/EPSG/0/3857”
}
},
“data”: [
{
“type”: “MODIS”,
“dataFilter”: {
“timeRange”: {
“from”: “2018-05-01T00:00:00Z”,
“to”: “2018-05-01T23:59:59Z”
}
}
}
]
},
“output”: {
“width”: 2245.653766240245,
“height”: 1580.389705482169,
“responses”: [
{
“identifier”: “default”,
“format”: {
“type”: “image/tiff”
}
}
]
},
“evalscript”: “//VERSION=3\nfunction setup() {\n return {\n input: [“B06”,“B02”, “dataMask”],\n output: { bands: 1 },\n mosaicking: “ORBIT”\n };\n}\nfunction SCI(sample) {\n let denom = sample.B06 + sample.B02;\n return ((denom != 0) ? (sample.B06 - sample.B02) / denom : 0.0);\n}\n\nfunction evaluatePixel(samples) {\n var sum = 0;\n var nonZeroSamples = 0;\n for (var i = 0; i < samples.length; i++) {\n var value = SCI(samples[i]) ;\n if (value != 0) {\n sum += value;\n nonZeroSamples++;\n }\n }\n return [sum / nonZeroSamples];\n}\n”
}’
THE EVALSCRIPT:
//VERSION=3
function setup() {
return {
input: [“B06”,“B02”, “dataMask”],
output: { bands: 1 },
mosaicking: “ORBIT”
};
}
function SCI(sample) {
let denom = sample.B06 + sample.B02;
return ((denom != 0) ? (sample.B06 - sample.B02) / denom : 0.0);
}
function evaluatePixel(samples) {
var sum = 0;
var nonZeroSamples = 0;
for (var i = 0; i < samples.length; i++) {
var value = SCI(samples[i]) ;
if (value != 0) {
sum += value;
nonZeroSamples++;
}
}
return [sum / nonZeroSamples];
}
On comparing a single date data and an average of 30days I find more cloud cover on a 30day average. And the values are not between as mentioned on the webpage assuming there is cloud cover in the data. I tried adding the maximum cloud coverage option in the script but the results does not seem to change.
Kindly let me know where are the faults in my code, and how do I remove the cloud cover?


