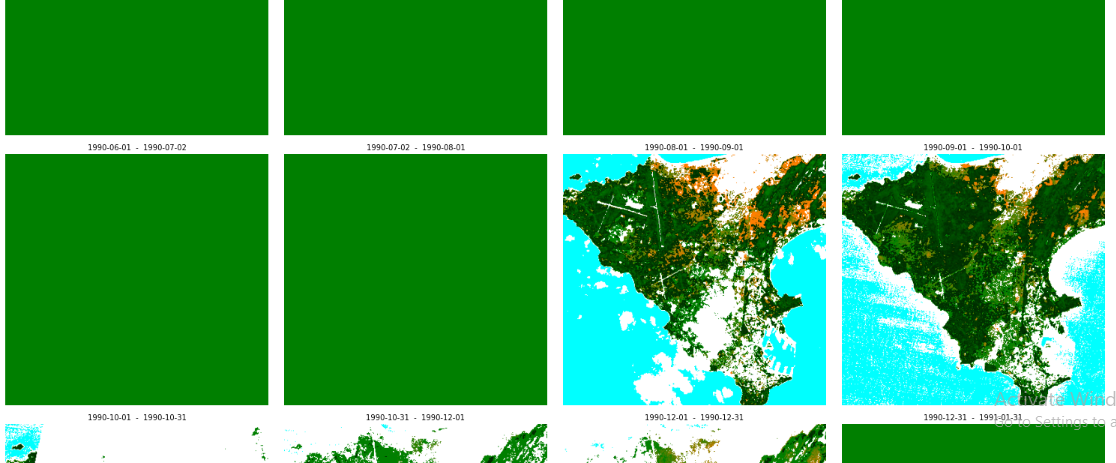
Hello all, I have searched alot but still unable to find what I need. Is there any LandSat satellite custom script available which will help me to detect Urban Area of my desired bbox: [-17.628331,14.554343,-17.171647,14.922227]
I try to modify this script for urban detection using Landsat(4-5)TM L1 satellite. It work for one or more image but when I request image for multi timestamps(19990-2010) it gives mostly images with out any classification like in the attached image.
How can I modify this script for urban detection:
Custom Script:
//VERSION=3
function evaluatePixel(samples) {
var NDWI=index(samples.B02, samples.B04);
var NDVI=index(samples.B04, samples.B03);
var BareSoil=2.5 *(( samples.B05 + samples.B03)-( samples.B04 + samples.B01))/(( samples.B05 + samples.B03)+( samples.B04 + samples.B01));
if (NDWI > 0.2) {
return [0, 0.5, 1, samples.dataMask]
}
if((samples.B07>0.8)||(NDVI<0.1)){
return[1,1,1, samples.dataMask]
}
if (NDVI>0.2){
return [0, 0.3*NDVI, 0, samples.dataMask]
}
else {
return [BareSoil, 0.2, 0, samples.dataMask]
}
}
function setup() {
return {
input: ["B01","B02", "B03", "B04", "B05", "dataMask"],
output: { bands: 3 }
};
}
Hi @fa20-rcs-003,
A quick check with our Catalog API showed that there are simply no acquisitions for the time ranges and data collection you defined (double-checked on USGS website). You can also use our Catalog API through our Requests Builder for a quick check in a user-friendly GUI.
fa20-rcs-003:
How can I modify this script for urban detection
Can you provide some more information about the expected output? Would you like to create a binary mask for urban features or a visualization?
The current script uses thresholds for several spectral indices to classify different features in the Landsat image. Urban features are displayed in white, but unfortunately the script also classifies clouds as urban features. I suggest you implement a cloud filtering logic with the help of Landsat BQA band in your script. For this, you will have to utilize the decodeL8C2Qa
function which is described in our documentation here.
Please check this EO Browser visualization for an adapted classification script that displays NoData values as black (instead of green) and clouds in red color.
Hope this helps
hey, thanks for the reply
I just wanted to do visualization of Urban area realted to this specific area of interset.
Btw thanks for the help
Reply
Enter your E-mail address. We'll send you an e-mail with instructions to reset your password.