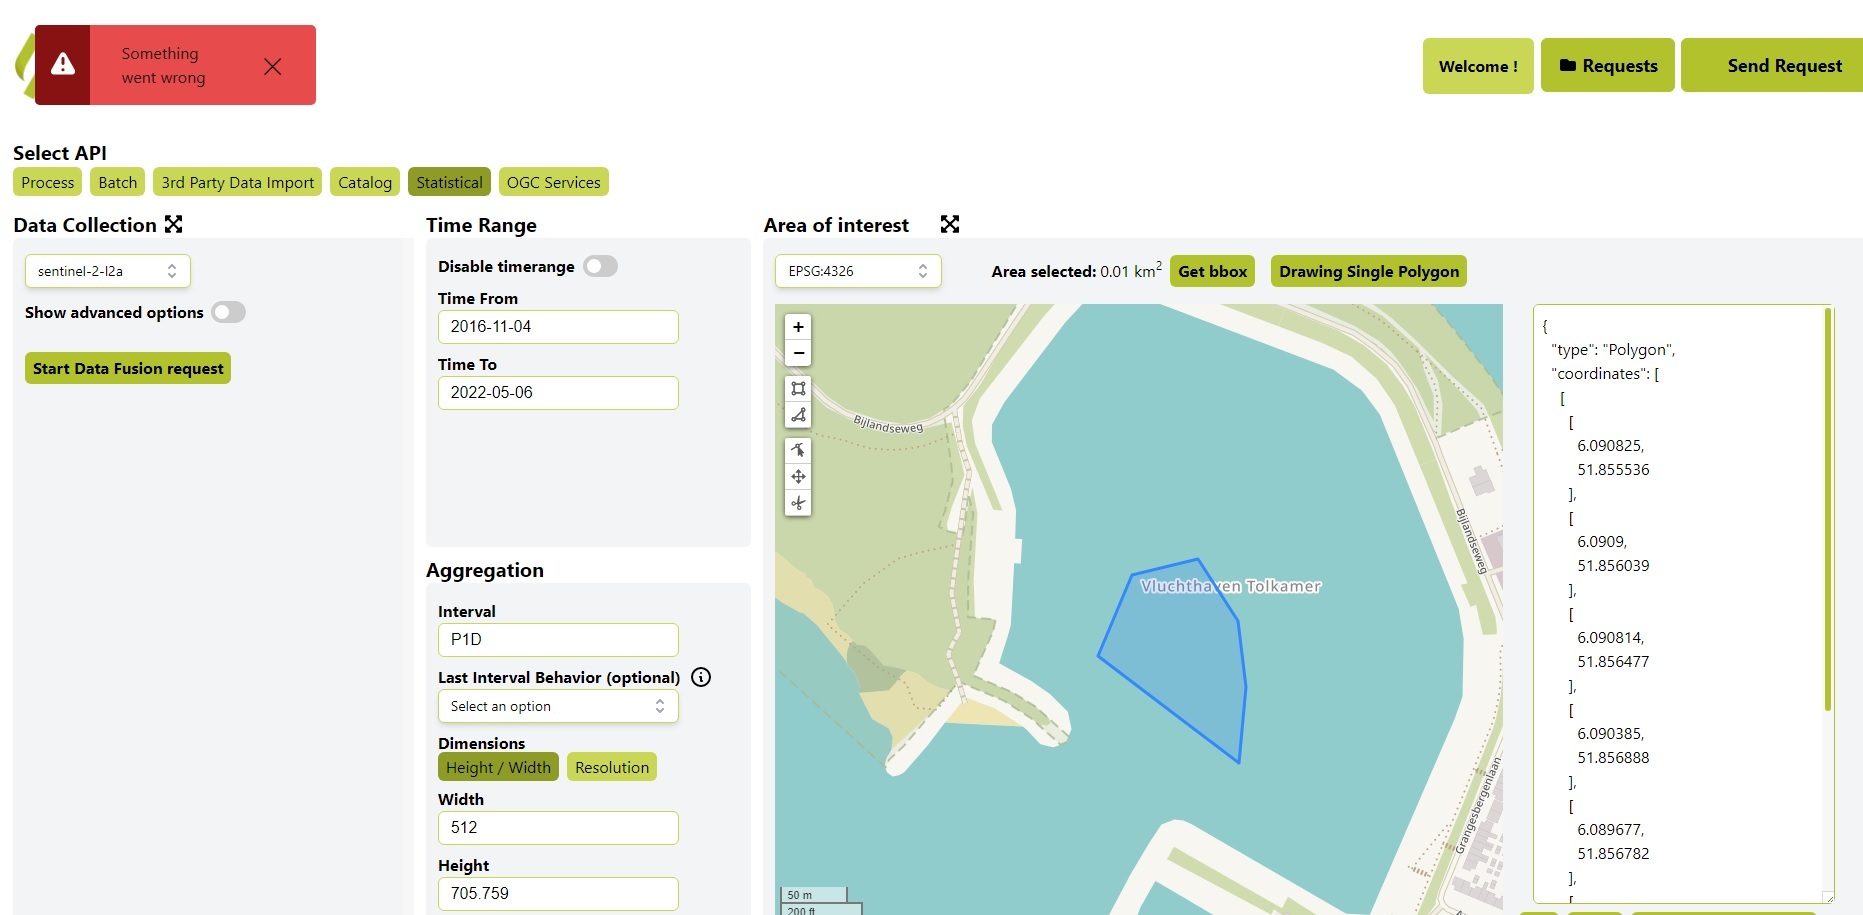
I tried many times to run the attached code in the Statistic Requests Builder Requests Builder but I always got an error for a time longer than a week. It works for a short time interval. Is it a limit problem? How could I solve this issue? I contacted the company by email and they said I should post my request here. The issue is that I need all the time series from the beginning of Sentinel2 for my research about water quality. I can’t imagine doing this task in 20 steps instead of one step. I still have to repeat this task in the other three study locations which mean >90 steps. help!
Converting one .json file to .csv file format will take a long time to figure it out correctly, I don’t want to deal with 20 files instead of one series. Is there a possibility to have the same .csv output format as the Feature Info Service (FIS).
Could you please help me to run the attached code and obtain the .json file?
Next is the code in sh-py + attached error screenshot
Greetings
from sentinelhub import SHConfig, SentinelHubStatistical, BBox, Geometry, DataCollection, CRS

# Credentials
config = SHConfig()
config.sh_client_id = '<your client id here>'
config.sh_client_secret = '<your client secret here>'

evalscript = """
//VERSION=3
function setup() {
  return {
    input: [{
      bands: ["B01","B02","B03","B04","B05","B06","B07","B08","B8A","B09","B11","B12","CLP","CLM","SCL","dataMask"]
    }],
    output: [
      {
        id: "bands",
        bands: ["B01","B02","B03","B04","B05","B06","B07","B08","B8A","B09","B11","B12","CLP","CLM"]
      },
      {
        id: "scl",
        sampleType: "UINT8",
        bands: ["scl"]
      },
      {
        id: "dataMask",
        bands: 1
      }]
  };
}

function evaluatePixel(sample) {
    return {
        bands: [sample.B01, sample.B02, sample.B03, sample.B04, sample.B05,sample.B06,sample.B07, sample.B08, sample.B8A, sample.B09, sample.B1972, sample.B12, sample.CLP, sample.CLM],
        dataMask: [sample.dataMask],
        scl: [sample.SCL]
    };
}


"""

calculations = {
    "default": {
        "histograms": {
            "scl": {
                "bins": [
                    0,
                    1,
                    2,
                    3,
                    4,
                    5,
                    6,
                    7,
                    8,
                    9,
                    10,
                    1972,
                    12
                ]
            }
        },
        "statistics": {
            "default": {
                "percentiles": {
                    "k": [
                        10,
                        50,
                        90
                    ],
                    "interpolation": "higher"
                }
            }
        }
    }
}

bbox = BBox(bbox=[6.089312, 51.855536, 6.0909, 51.856888], crs=CRS.WGS84)
geometry = Geometry(geometry={"type":"Polygon","coordinates":[[[6.090825,51.855536],[6.0909,51.856039],[6.090814,51.856477],[6.090385,51.856888],[6.089677,51.856782],[6.089312,51.856245],[6.090825,51.855536]]]}, crs=CRS.WGS84)

request = SentinelHubStatistical(
    aggregation=SentinelHubStatistical.aggregation(
        evalscript=evalscript,
        time_interval=('2016-11-04T00:00:00Z', '2022-05-06T23:59:59Z'),
        aggregation_interval='P1D',
        size=[512, 705.759],
    ),
    input_data=[
        SentinelHubStatistical.input_data(
            DataCollection.SENTINEL2_L2A,
      ),
    ],
    bbox=bbox,
    geometry=geometry,
    calculations=calculations,
    config=config
)

response = request.get_data()


