What you can do is use outputMetadata to return NDVI statistics and “regular” output for true color.
For the ndvi part you can find a similar example below
//VERSION=3
function setup() {
return {
input: u"lulc_predictions", "dataMask"],
output: {
id: "default",
bands: 0
}
}
}
function updateOutputMetadata(scenes, inputMetadata, outputMetadata) {
var land_cover_output = t];
for (let key in land_cover) {
land_coverokey] = land_coverokey] / count;
land_cover_output.push({
"name": parseInt(key),
"coverage": land_coverokey]
})
}
outputMetadata.userData = {
"lulc":
land_cover_output
}
}
var land_cover = {};
var count = 0;
function evaluatePixel(sample) {
let x = sample.lulc_predictions;
if (sample.dataMask != 0) {
if (!(x in land_cover)) {
land_coverox] = 1;
} else {
land_coverox] += 1;
}
count += 1;
}
}
Cool, thanks grega for yout quick response.
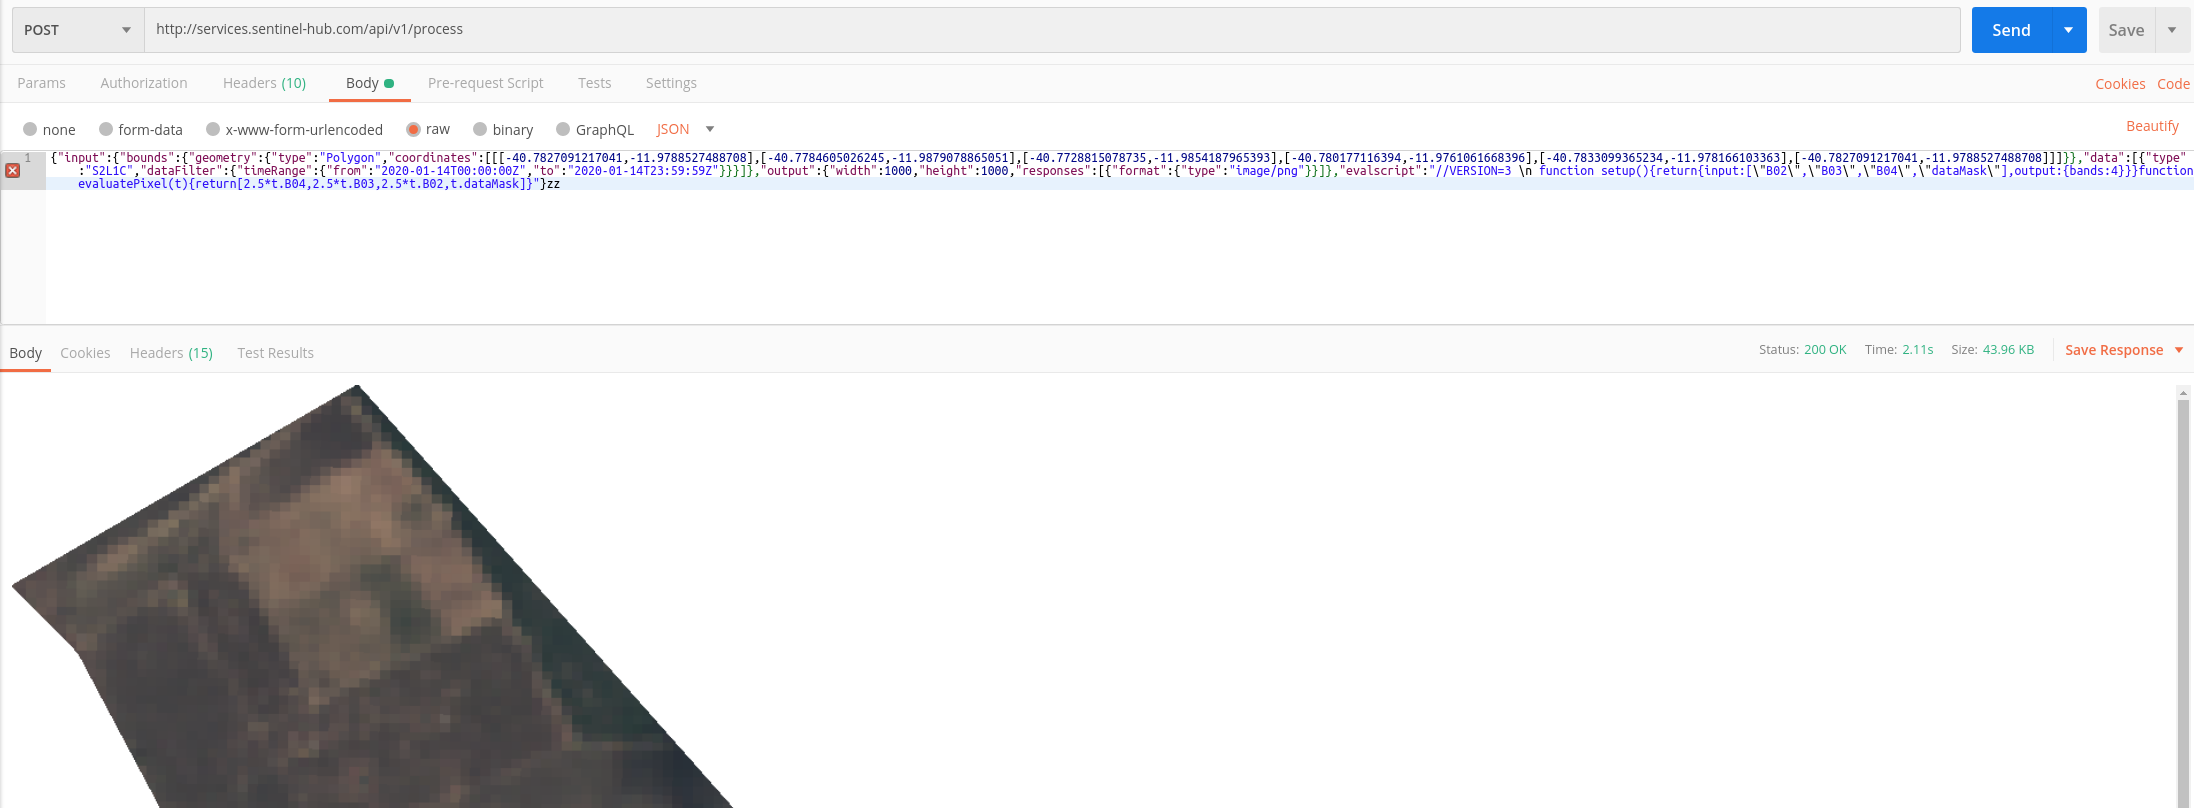
And whats is the type of the return ? Because, the way I use the rest full APi the response is a single JPEG that represents the image of the polygon,
In this case Will I have multiple polygon images with multiple indexes ?
The updateMetadata comes as a JSON, I think.
For the rest you can have multiple JPGs or something else. See 2nd example here:
https://docs.sentinel-hub.com/api/latest/#/Evalscript/V3/README?id=examples
Ok, I will check
For me sounds weird a RESTFul endpoint returns at the same time images (png) and a JSON
Well, I thought you asked for this
See this example:
docs.sentinel-hub.com
Sentinel Hub is multi-spectral, temporal satellite imagery service for real-time processing of big remote sensing data.
You can also download these examples as Postman collection (check the top of the page).
Cool I checked here.
Now I’m able to use the Postman collection.
But, I realize even I specify a time range, the .tar file comes with one single image from one specific date, and the JSON comes with all dates with its indexes.
Is possible to get the all images from the range in a single request ? Is not ?
If the range is 2020-02-01 to 2020-02-20 I’d like to get all available images in these days
Thanks for the help
Regards
Ah, now I understand… you would like to get one image and statistical analysis time-series.
This is not possible due to optimized processing of FIS service, which does not go along the image…
Yes,
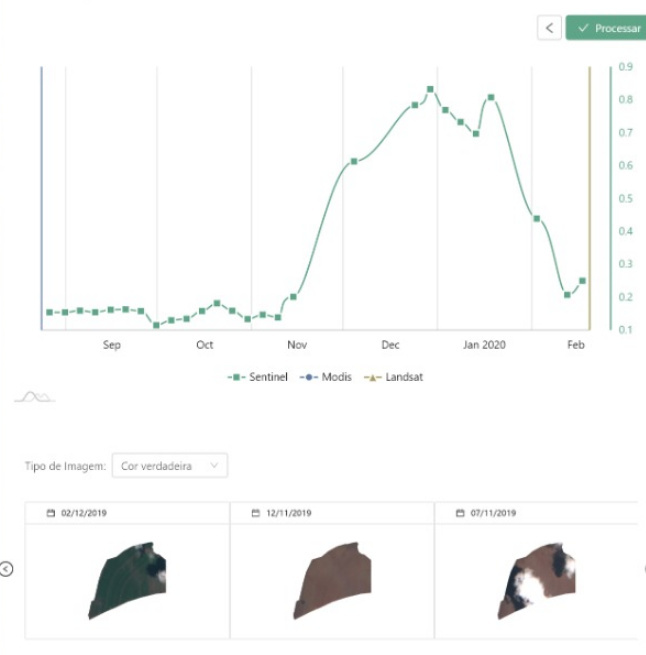
Today we plot a time-series chart with NDVI indexes and for each date we grab the image related to that date in a individual request .
But in large time range, the user request takes too long, if the time range represents 50 days we do 50 individual request to get the polygon image.
But, ok, anyway, thanks for your help
I understand. Trying to generate 50 images with one request would actually take even longer.
I suggest you paralellise your requests, e.g. 5 parallel threads.