Hello,
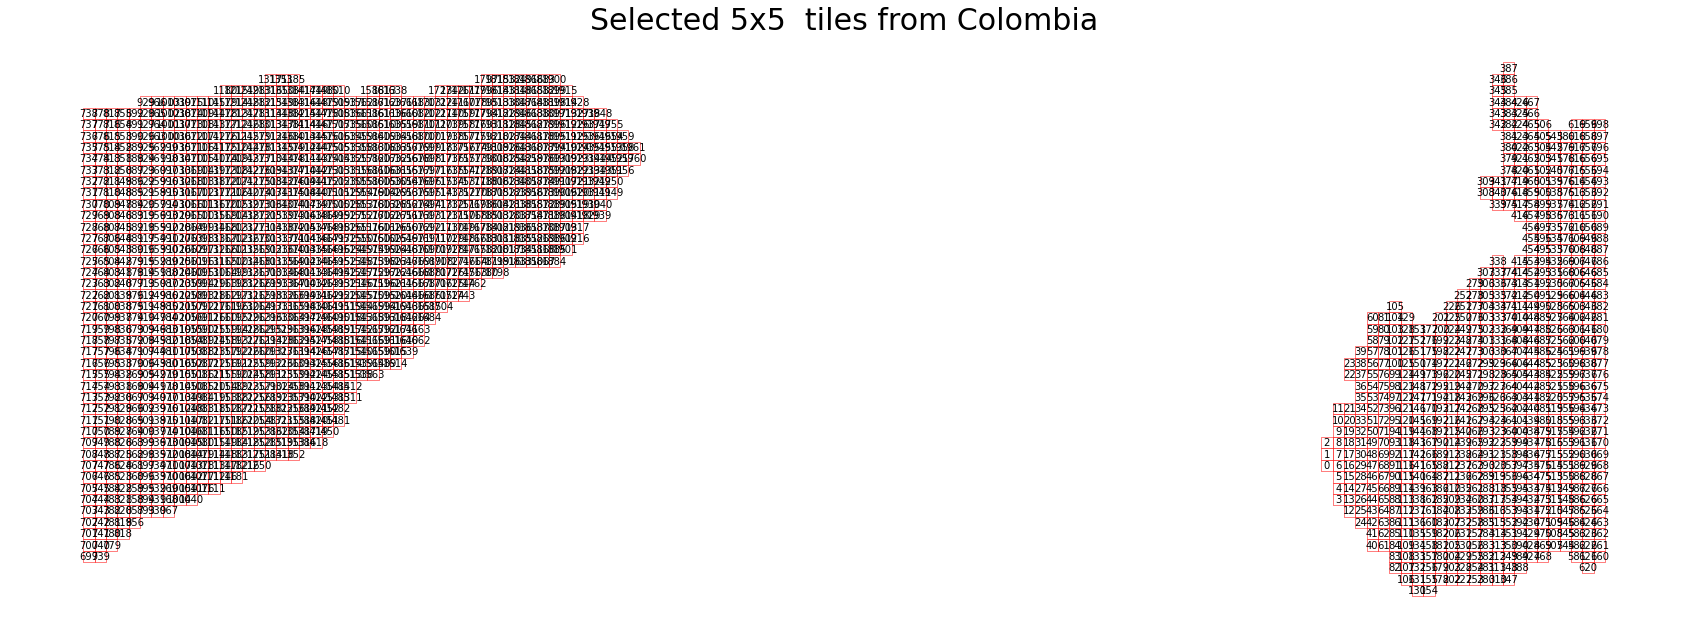
I am using UtmZoneSplitter and UtmGridSplitter to divide a zone that spans across multiple UTM zones. I then create the bbox_list and bbox_list and having that I create the GeoDataFrame which I use for plotting. I am following this example How To: Land-Use-Land-Cover Prediction for Slovenia. But when the plot is created it seems like the bboxes are divided into two groups. I have tested it in zones that do not span across multiple zones and it works perfectly.
country = gpd.read_file(os.path.join(DATA_FOLDER, 'COLOMBIA.shp'))

depto = country[country.DPTO_CNMBR == "CASANARE"]

# Get the shape in polygon format
country_shape = country.geometry.values[-1]

depto_shape = depto.geometry.values[-1]

depto.plot()
plt.axis('off');
This shows the image of the area correcly.
Here is the part where I get the bbox_list and plot the bboxes
# Create the splitter to obtain a list of bboxes
bbox_splitter = UtmGridSplitter([depto_shape], CRS.WGS84, 5000)

bbox_list = np.array(bbox_splitter.get_bbox_list())
info_list = np.array(bbox_splitter.get_info_list())

# Prepare info of selected EOPatches
geometry = [Polygon(bbox.get_polygon()) for bbox in bbox_list]


idxs = [info['index'] for info in info_list]
idxs_x = [info['index_x'] for info in info_list]
idxs_y = [info['index_y'] for info in info_list]

gdf = gpd.GeoDataFrame({'index': idxs, 'index_x': idxs_x, 'index_y': idxs_y},
                           crs=country.crs,
                           geometry=geometry)

# figure
fig, ax = plt.subplots(figsize=(30, 30))
gdf.plot(ax=ax,facecolor='w',edgecolor='r',alpha=0.5)
ax.set_title('Selected 5x5  tiles from Colombia', fontsize=30);
for bbox, info in zip(bbox_list, info_list):
    geo = bbox.geometry
    ax.text(geo.centroid.x, geo.centroid.y, info['index'], ha='center', va='center')
But this plots the image below. Any idea on how to plot the boxes correctly?


