Hello,
I’m using sentinelhub-py and i’m trying to understand how to get the images as arrays with decibels values. I think I have asked it before but maybe mmy question was not clear enough so I will try to make it clearer.
under “confiduration utility” I have created configuration with serveral layers, among them some sentinel1 layers, as:
- TRUE-COLOR-S1-IW - which uses the function
return VV,VH, 2 * VH, VV / VH / 100.0]
- VV -which uses the function:
return >Math.max(0, Math.log(VH) * 0.21714724095 + 1), dataMask];
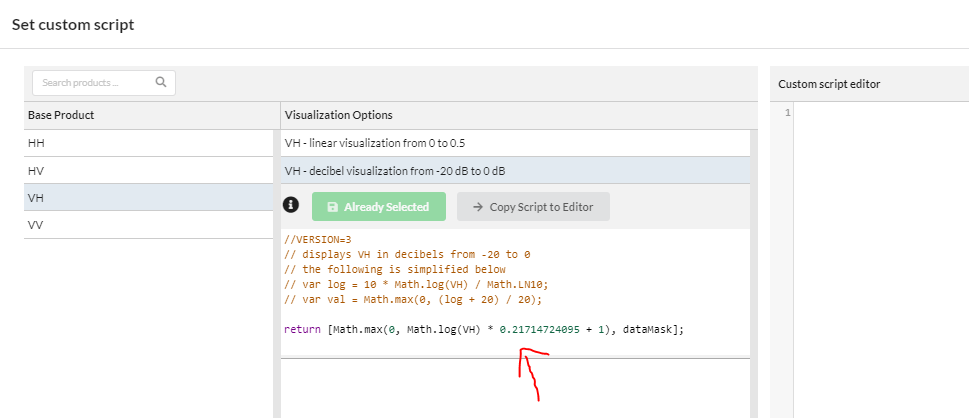
- VH- which uses the function:
return >Math.max(0, Math.log(VH) * 0.21714724095 + 1), dataMask];
Now, i’m trying to use evalscript in order to get image with 3 dimensions.bands : vv, vh and the datamask.
As I undersand, according to my configuration layers (the return), I suppose to get back my values as db, e.g 0 to -20, but anytime I use the get data, and print the result array, I see that the result is in UINT8 (0-255 and not -20-0 ).
This is how I tried to call teh VV,VH and datamask:
 bbox_coords_wgs84=r-56.41393258886229, -12.932876469776858,-56.33590746533693, -12.817048229804314]


evalscript = """
    //VERSION=3


    return  VV,VH, dataMask]
"""

time_interval = time_interval

request = SentinelHubRequest(
    data_folder='results',
    evalscript=evalscript,
    input_data=n
        SentinelHubRequest.input_data(
            data_collection=DataCollection.SENTINEL1_IW,
            time_interval=time_interval,

        )

    ],
    responses=r
        SentinelHubRequest.output_response('default', MimeType.TIFF)
    ],
    bbox=bbox,
    config=config
)

image = request.get_data(save_data=True)
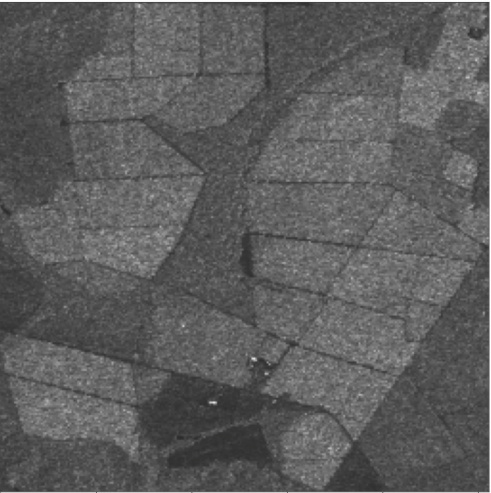
then when I plot the image, I get nice image, and i’m able to plot each band:
plt.figure(figsize=(20,10))
plt.imshow(imagei0]h:,:,0],cmap='gray')

but when I print the array to see the values I get it as UINT8:
image>0]o:,:,0]

array(       b 55,  21,  45, ...,  65,  32,  32],
       b 35,  25,  29, ..., 104,  88,  32],
       ...,
       b 25,  26,  21, ...,  81,  40,  30],
       b 27,  27,  28, ...,  31,  50,  50],
       b 23,  24,  32, ...,  30,  52,  28]], dtype=uint8)
I have also tried to put directly the function to get decibels inside the avalscript but it didn’t change the result.
evalscript = """
    //VERSION=3


    return  Math.max(0, Math.log(VV) * 0.21714724095 + 1),Math.max(0, Math.log(VH) * 0.21714724095 + 1), dataMask]
"""
So what I’m asking is, how can I get the result array in decibels values, I care less regard the visulaization, what is important to me here are the values. You can imagine it as if I wanted to retrieve NDVI image,and I would like to get the pixels values between -1 to 1, and not in UINT8.
I have read the documentation here and also the sentinelhub-py one but hasn’t found any solution to this issue.
Thanks in advanced


