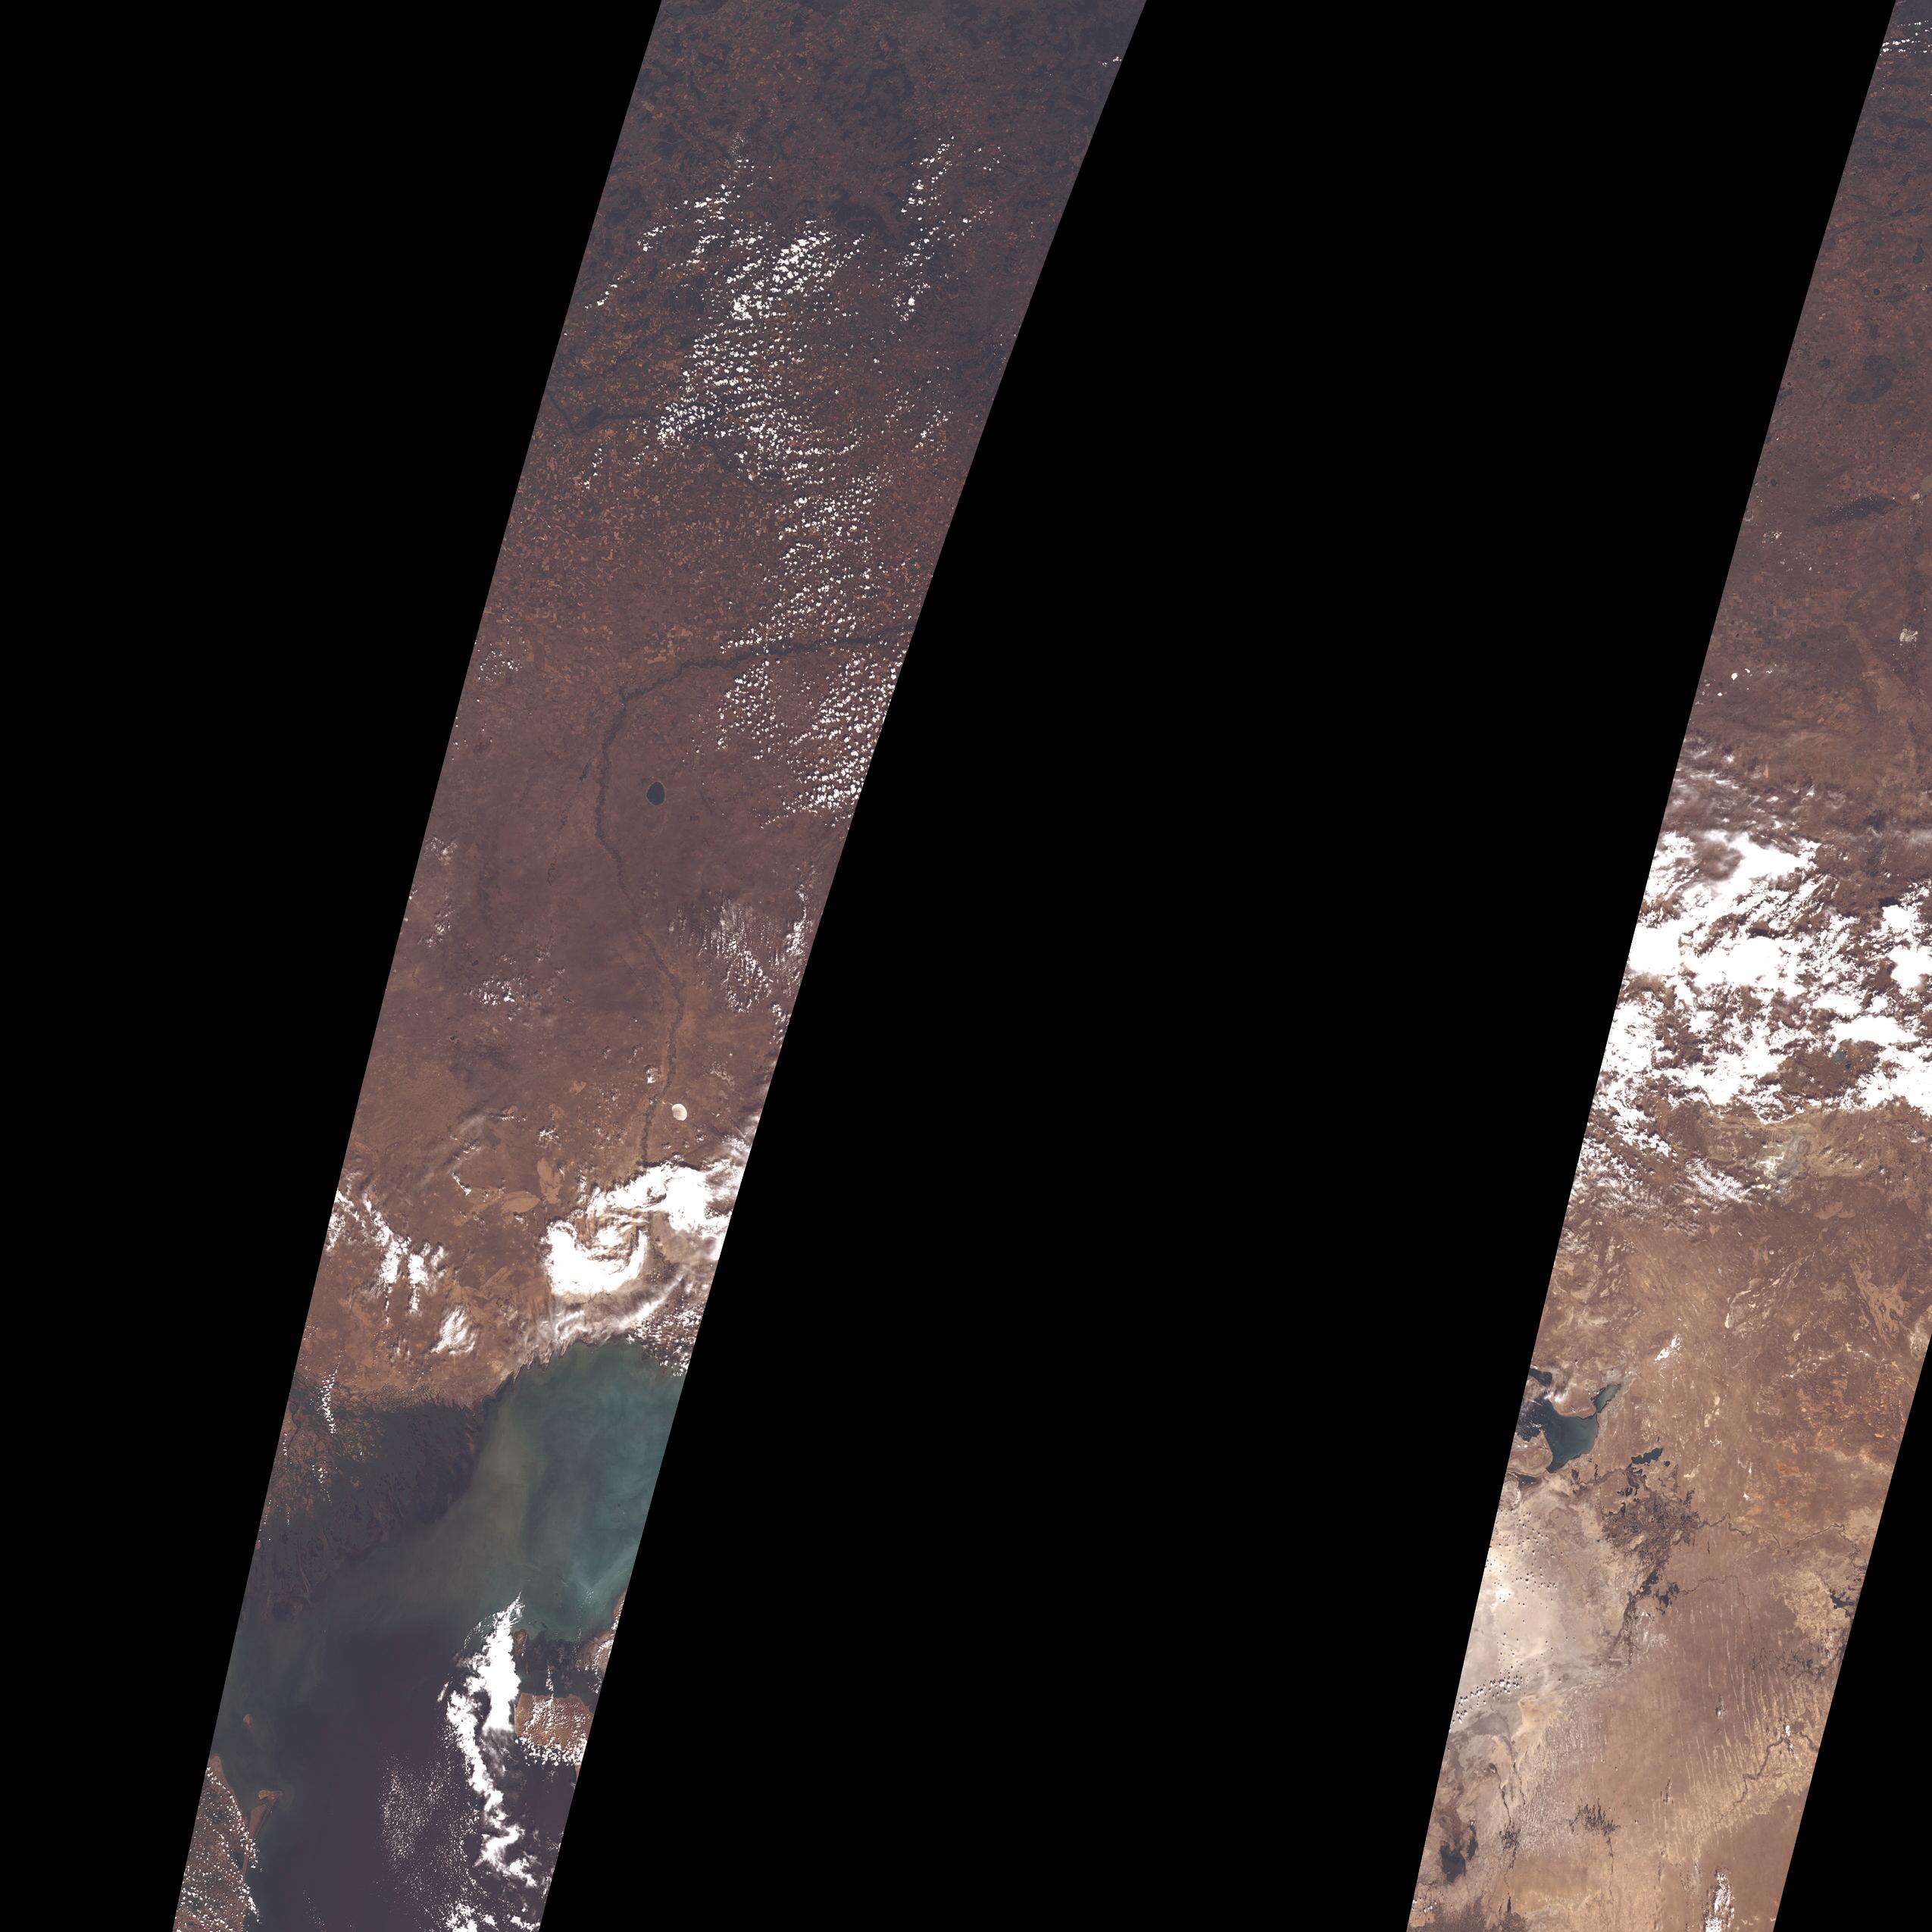
I want to get large image as one image.
Question:
bbox = [7200979.560689886, 7514065.628545968, 5009377.085697314, 5322463.153553395]
bbox = BBox(bbox=bbox, crs=CRS.POP_WEB)
bbox = bbox.transform(crs=CRS.WGS84)
wms_request = WmsRequest(
layer=‘TRUE_COLOR’,
bbox=_bbox,
width=512,
height=512,
maxcc=0.3,
custom_url_params={
CustomUrlParam.SHOWLOGO: False,
},
image_format=MimeType.JPG,
config=config)
Hello,
To deal with large areas such as the one you are specifying, there are several solutions. Sentinel Hub developed a suite of tools called Large area utilities to request data over larger areas using the Sentinel Hub Python package. For more efficient, cheaper processing you could also take a look at Sentinel Hub’s Batch API, that can be called in a “classic way” or using the Requests Builder.
In this post I will use the Large area utilities to guide you. I would use the tool to split your area into smaller sub-zones, download the files and merge them together. Since we need to merge the files together, you would have to download the data as Geotiffs.
- The first step would be to split the areas into smaller zones, here let’s try 25 zones (5x5, you can always modify this amount to your liking):
from sentinelhub import BBoxSplitter, CRS
# Here we are splitting you bbox that was transformed to WGS84 into 5x5 areas
bbox_splitter = BBoxSplitter(pbbox.geometry], CRS.WGS84, (5, 5))
# Get a list of bboxes from the splitter
bbox_list = bbox_splitter.get_bbox_list()
- In a second step we download the data (as Geotiffs) using a slightly modified version of your WmsRequest:
# Loop over the list of smaller bboxes
for small_bbox in bbox_list:
wms_request = WmsRequest(layer="TRUE_COLOR",
# Specify where you will save the data
data_folder='a_directory_of_your_choice',
bbox=small_bbox,
width=512,
height=512,
maxcc=0.3,
custom_url_params={CustomUrlParam.SHOWLOGO: False},.
# Specify the file format
image_format=MimeType.TIFF,
# Set a time interval to avoid too many blank images
time_difference=datetime.timedelta(hours=2),
config=config)
# Save the data to disk
wms_bands_img = wms_request.save_data()
- Now we need to merge the data together. You could modify this script that was written for internal purposes, but that would mean running an external script. If you want the workflow to be integrated in your Python script, you could use the
gdal
library and do the following:
from pathlib import Path
from osgeo import gdal
# List the downloaded Tiffs in the different subfolders with pathlib (native library)
file_list = _f"{x}/response.tiff" for x in Path("a_directory_of_your_choice").iterdir()]
# Create a virtual raster
vrt_all = gdal.BuildVRT('/some/output/folder/merged.vrt', file_list)
# Convert to JPEG
gdal.Translate('/some/output/folder/out.jpeg','/some/output/folder/merged.vrt')
I tested it for a single date over your area of interest:
Maxim
Thanks!!!
Sure I understand your solution and I did this way.
But want way as leaflet in js. Large areas like this in leaflet fit with fitbounds methods and download easly.
A post was split to a new topic: Error in patch visualisation
Reply
Enter your E-mail address. We'll send you an e-mail with instructions to reset your password.