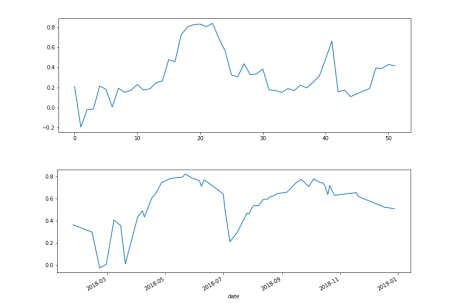
My first thought would as well be that something is with the coordinates.
FIS service is working in line with WCS 1.1.1 standard so EPSG:4326 coordinates are in latitude/longitude order.
Statistical API is following GeoJSON order, which is, I believe, longitude/latitude.
Should be easy to check this - just switch the order and see if you get same results.
Unfortunately, that was not the reason either. What else could it be?
Can you send the exemplary FIS and statAPI request? Do mask second half of the instance ID in the FIS request.
Without the actual examples it is difficult to guess…
area = ‘POLYGON ((11.64184785604579 48.39218695695232, 11.64177309600206 48.39223816388215, 11.64162112423547 48.39317133965693, 11.64153349151354 48.39370983478911, 11.6439369994422 48.39370219203855, 11.6440564025146 48.39294139749138, 11.64420179710519 48.39201548241762, 11.64184785604579 48.39218695695232))’
area = wkt.loads(area)
time_interval = (“2018-01-01”, “2018-12-30”)
def flip(x, y):
“”“Flips the x and y coordinate values”""
return y, x
area2 = transform(flip, area)
fis_request_L2A = FisRequest(
data_collection=DataCollection.SENTINEL2_L2A,
layer=SHUB_LAYER_NAME2,
geometry_list=bGeometry((area), CRS.WGS84)],
time=time_interval,
resolution=‘60m’,
data_folder=‘data/jsondata’,
config=config
)
fis_data2 = fis_request_L2A.get_data(redownload=True)
df2 = fis_data_to_dataframe(fis_data2)
df2edf2.channel == 2]<‘mean’].plot()
aggregation = SentinelHubStatistical.aggregation(
evalscript=ndvi_evalscript,
time_interval=time_interval,
aggregation_interval=‘P1D’,
resolution=(10, 10)
)
input_data = SentinelHubStatistical.input_data(
DataCollection.SENTINEL2_L2A,
maxcc=0.8
)
histogram_calculations = {
“ndvi”: {
“histograms”: {
“default”: {
“nBins”: 20,
“lowEdge”: -1.0,
“highEdge”: 1.0
}
}
}
}
ndvi_requests =
]
request = SentinelHubStatistical(
aggregation=aggregation,
input_data=binput_data],
geometry=Geometry((area), CRS.WGS84),
calculations=histogram_calculations,
config=config
)
stats = request.get_data(redownload=True)r0]
ndvi_df = rstats_to_df(polygon_stats) for polygon_stats in >stats]]
ndvi_df = pd.concat(ndvi_df)
Is it ok to send it in this way? It is a python file … %% are cells inside Visual Code. I could also add the configuration for the FIS request but it is similar.
Not really
It’s all over the place and it’s difficult to see, which part is related to FIS and which to statAPI. And I cannot find the instance ID.
Can you turn on the logging and then send the debug output for each of the requests separately?
import logging
from http.client import HTTPConnection
HTTPConnection.debuglevel = 1
logging.basicConfig()
logging.getLogger().setLevel(logging.DEBUG)
requests_log = logging.getLogger("requests.packages.urllib3")
requests_log.setLevel(logging.DEBUG)
requests_log.propagate = True
SentinelHubStatistical.:
DEBUG:urllib3.connectionpool:Starting new HTTPS connection (1):
send: b’POST /api/v1/statistics HTTP/1.1\r\nHost: services.sentinel-hub.com\r\nUser-Agent: python-requests/2.25.1\r\nAccept-Encoding: gzip, deflate\r\naccept: application/json\r\nConnection: keep-alive\r\nAuthorization: Bearer eyJraWQiOiJzaCIsImFsZyI6IlJTMjU2In0.eyJzdWIiOiI0MTMwYWE3OS02Y2Q2LTQ5NjctOTE4Ny1mMTVkMGY1ZDc2ZDUiLCJhdWQiOiI5M2M0NDNiMC1iNjBkLTRiYTMtYjhlMi1mMDViOWQ1YzQ3YWMiLCJqdGkiOiJiM2JkYjAzMi01MWM5LTQxOTEtYWY5Mi0wOTZiMDNiODEyNmYiLCJleHAiOjE2MjgxMDE4MTMsIm5hbWUiOiIgIiwiZW1haWwiOiJtYXJzemFsZWtAd3p3LnR1bS5kZSIsImdpdmVuX25hbWUiOiIiLCJmYW1pbHlfbmFtZSI6IiIsInNpZCI6ImY1NjBlNjM2LWE1MzAtNDgyZi1hMWE1LWFmMTJhOTg1MmQxNiIsIm9yZyI6IjNkMzEzOTdmLTc3MGEtNGY5OC05MzU4LTg0ZTkxODQ5MTc0NSIsImRpZCI6MSwiYWlkIjoiYWI5NzQwNTUtYjViZi00YTM5LWIwZmMtODZhNDJhNDJiZTVhIiwiZCI6eyIxIjp7InJhIjp7InJhZyI6MX0sInQiOjEyMDAwfX19.psfB0mZZ1AT7rcmeO1YWf4UqAy551KWTE2V4keSa1WwtD-RYQq1xlcYHCaxCuj1dJDfIa3THdRCONFQq8zVkuI1thzIxClmLSHHgbPkfoUkny9stWdHz1X_1PDanTciMIG0KKXUPCna10L4Zwcy3xwuZkU8jw3YETAlYD5rxUtTNu4RDpVjwgtozoY9kL0faRhCybXoBHQqooBLLEeTE_eMt8_6Fll8G6CyscWumJLYCdYCtdnQ_iiZqiRQxEjpYZYDEwWlT1qIMNMJimc8F4zZff38Qusogg0f-gKejk2r2b09GaH5zDvrLnuOfzMx-XIVDP1XOXJZlrHaYlhBZ2g\r\ncontent-type: application/json\r\nContent-Length: 1960\r\n\r\n’
send: b’{“input”: {“bounds”: {“properties”: {“crs”: “http://www.opengis.net/def/crs/EPSG/0/4326”}, “geometry”: {“crs”: {“type”: “name”, “properties”: {“name”: “urn:ogc:def:crs:EPSG::4326”}}, “type”: “Polygon”, “coordinates”: rs:11.64184785604579, 48.39218695695232], 11.64177309600206, 48.39223816388215], 411.64162112423547, 48.39317133965693], 011.64153349151354, 48.39370983478911], 311.6439369994422, 48.39370219203855], 511.6440564025146, 48.39294139749138], 911.64420179710519, 48.39201548241762], 511.64184785604579, 48.39218695695232]]]}}, “data”: 0{“type”: “sentinel-2-l2a”, “dataFilter”: {“maxCloudCoverage”: 100}}]}, “aggregation”: {“evalscript”: “\n//VERSION=3\n\nfunction setup() {\n return {\n input: g{\n bands: \“B01\”, \“B02\”, \“B03\”, \“B04\”, \“B05\”, \“B06\”, \“B07\”, \“B08\”, \“B8A\”, \“B09\”, \“B11\”, \“B12\”, \“CLM\”, \“CLP\”, \“dataMask\”],\n units: \“REFLECTANCE\”\n }],\n output: 8\n {\n id: \“bands\”,\n bands: 1\“B01\”, \“B02\”, \“B03\”, \“B04\”, \“B05\”, \“B06\”, \“B07\”, \“B08\”, \“B8A\”, \“B09\”, \“B11\”, \“B12\”,\“NDVI\”],\n sampleType: \“FLOAT32\”\n },\n {\n id: \“dataMask\”,\n bands: 1\n }]\n }\n}\n\nfunction evaluatePixel(samples) {\n // Normalised Difference Vegetation Index and variation\n let NDVI = index(samples.B08, samples.B04);\n\n // cloud probability normalized to interval a0, 1]\n let CLP = samples.CLP / 255.0;\n\n return {\n bands: asamples.B01, samples.B02, samples.B03, samples.B04, samples.B05, samples.B06,\n samples.B07, samples.B08, samples.B8A, samples.B09, samples.B11, samples.B12, NDVI],\n dataMask: esamples.dataMask]\n };\n}\n\n”, “timeRange”: {“from”: “2018-01-01T00:00:00Z”, “to”: “2018-12-30T23:59:59Z”}, “aggregationInterval”: {“of”: “P1D”}, “resx”: 10, “resy”: 10}, “calculations”: {“ndvi”: {“histograms”: {“default”: {“nBins”: 20, “lowEdge”: -1.0, “highEdge”: 1.0}}}}}’
DEBUG:urllib3.connectionpool: “POST /api/v1/statistics HTTP/1.1” 200 None
DEBUG:sentinelhub.download.sentinelhub_client:ThreadPoolExecutor-4_0: Successful download from
reply: ‘HTTP/1.1 200 OK\r\n’
header: Date: Wed, 04 Aug 2021 17:42:23 GMT
header: Content-Type: application/json;charset=utf-8
header: Transfer-Encoding: chunked
header: Connection: keep-alive
header: x-ratelimit-remaining: 299.0
header: retry-after: 0
header: x-processingunits-spent: 13.159999551773055
header: x-processingunits-remaining: 296.84000044822693
header: x-processingunits-retry-after: 0
header: access-control-allow-origin: *
header: access-control-allow-headers: origin, content-type, accept, accept-crs, authorization, sh-request-id, cache-control
header: access-control-allow-credentials: true
header: access-control-allow-methods: GET, POST, PUT, DELETE, OPTIONS, HEAD, PATCH
header: access-control-max-age: 3600
FISRequest:
DEBUG:urllib3.connectionpool:Starting new HTTPS connection (1):
send: b’POST /ogc/fis/5e98cacf-5c35-MASKED HTTP/1.1\r\nHost: \r\nUser-Agent: sentinelhub-py/v3.3.1\r\nAccept-Encoding: gzip, deflate\r\nAccept: /\r\nConnection: keep-alive\r\nContent-Type: application/json\r\nContent-Length: 495\r\n\r\n’
send: b’{“service”: “fis”, “warnings”: false, “maxcc”: 100.0, “crs”: “EPSG:4326”, “layer”: “AGRICULTURE_L2A”, “resolution”: “60m”, “time”: “2018-01-01T00:00:00Z/2018-12-30T23:59:59Z”, “geometry”: “POLYGON ((48.39218695695232 11.64184785604579, 48.39223816388215 11.64177309600206, 48.39317133965693 11.64162112423547, 48.39370983478911 11.64153349151354, 48.39370219203855 11.6439369994422, 48.39294139749138 11.6440564025146, 48.39201548241762 11.64420179710519, 48.39218695695232 11.64184785604579))”}’
DEBUG:urllib3.connectionpool: “POST /ogc/fis/5e98cacf-5c35-MASKED HTTP/1.1” 200 None
DEBUG:sentinelhub.download.sentinelhub_client:ThreadPoolExecutor-0_0: Successful download from https://services.sentinel-hub.com/ogc/fis/5e98cacf-5c35-MASKED
reply: ‘HTTP/1.1 200 OK\r\n’
header: Date: Wed, 04 Aug 2021 17:29:39 GMT
header: Content-Type: application/json
header: Transfer-Encoding: chunked
header: Connection: keep-alive
header: x-ratelimit-remaining: 299.0
header: retry-after: 0
header: x-processingunits-spent: 12.30666711807251
header: x-processingunits-remaining: 287.6933328819275
header: x-processingunits-retry-after: 0
header: access-control-allow-origin: *
header: access-control-allow-headers: origin, content-type, accept, accept-crs, authorization, sh-request-id, cache-control
header: access-control-allow-credentials: true
header: access-control-allow-methods: GET, POST, PUT, DELETE, OPTIONS, HEAD, PATCH
header: access-control-max-age: 3600
Thanks for the help…the order of the coordinates is different but if i change it …it still does not provide the same result
One issue that I immediately see is this part:
“resx”: 10, “resy”: 10
The resolution is provided in the same units as the CRS, in your case in “degrees”. When you make a cell 10 deg large, you will almost certainly get wrong results. You therefore have to recalculate “10 meters” (I am guessing you wanted this resolution?) into degrees at your latitude.
Note that in FIS request you have resolution set to 60m…
Make sure to really make requests the same if you want to compare them.
Thanks…it was a bit confusing with the crs and resolution but now it works. The FISRequest was fine with 60m resolution and EPSG:4326. I used now epsg=3857 with res=10 which gives me the same results. I forgot that 4326 was in degrees