
Exporting Min/Max/Mean from Vegetation Indices Time Series

  • 26 April 2024
  • 7 replies
  • 11 views

Hi,

I am new to the EO community. It’s great to see a well-maintained and popular forum for Sentinel Hub. I have a question about Sentinel-2 data (L2A) products, specifically calculated vegetation indices.

From my Configuration Utility I have created new configuration for available data L2A (ID e814485d-2d6f-MASKED). Then I have prepared data with no clouds from whole possible terms.

After that I have prepared URL address for generating values (vegetation index from L2A data with Sen2Cor atmospheric corrections, resolution of L2A 10m and only 5% of clouds, from all possible scenes - time) for my observed locality (BBOX in WGS 84) in the Sumava National Park (Czechia). Here it is:
http://services.sentinel-hub.com/ogc/fis/e814485d-2d6f-MASKED?LAYER=VEGETATION_INDEX&CRS=CRS%3A84&TIME=2015-01-01%2F2019-2-25&BBOX=48.985135,13.522797,48.984322,13.524106&RESOLUTION=10&MAXCC=5&ATMFILTER=FULL

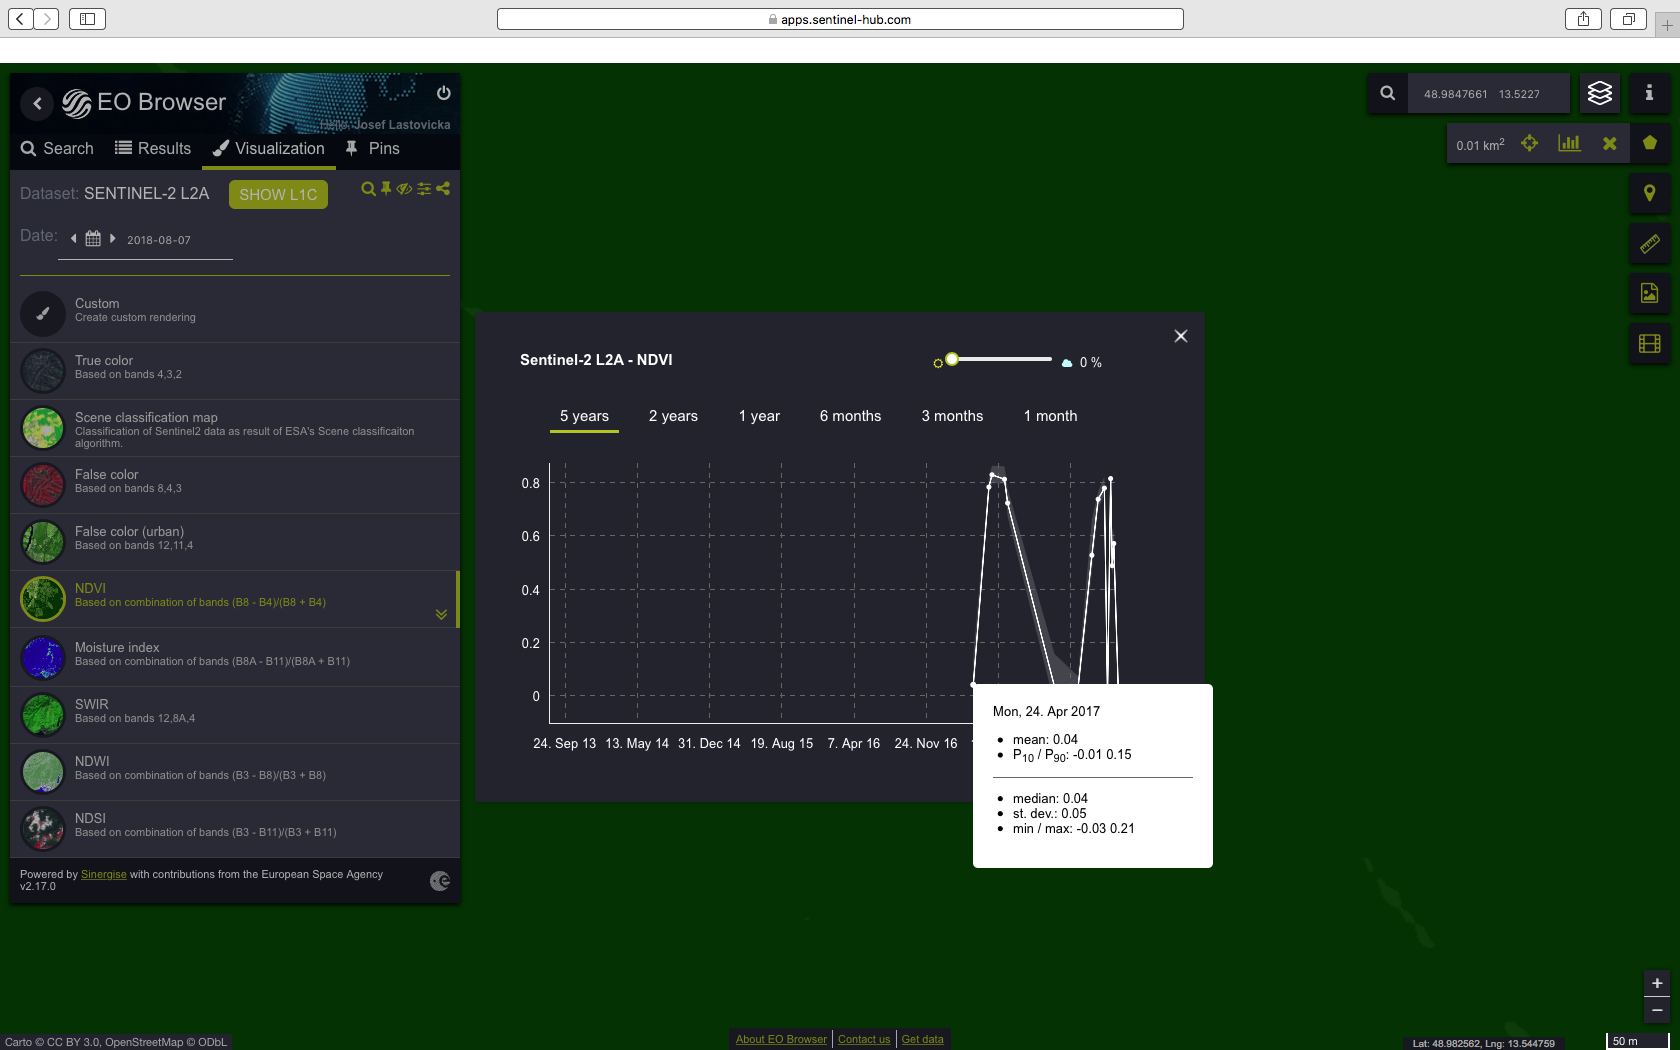
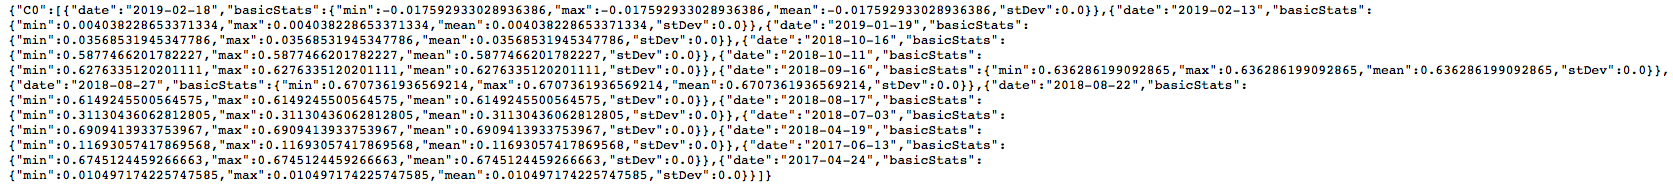
But there has to be a problem with generating the values, because the dates are not corresponding, st. deviation are zeros (and also min/max) and means of vegetation indices (NDVI and Moisture Index) are different from the EO browser app if I manually select the same area.

Can anybody help me? Thank you very much!!

Best
 

First some general comments related to your configuration and request:


Looking at the results of the request, results only available since December 2018, I feel that your coordinates are wrong, that you are looking at area outside Europe. So probably lat and lon are switched?


By changing the order I get results from 2017 as one would have expected:
http://services.sentinel-hub.com/ogc/fis/e814485d-2d6f-MASKED?LAYER=VEGETATION_INDEX&CRS=CRS%3A84&TIME=2015-01-01%2F2019-2-25&BBOX=13.522797,48.985135,13.524106,48.984322&RESOLUTION=10&MAXCC=5&ATMFILTER=NONE

(Note that I masked the instance ID os that others cannot abuse it)


In order to get actual values rather than visualisation, I suggest you check this post:

198f5a8b2d447379e96d1fe56fdbf333f1dfad4d.pngsentinel-hub.com
d3714e73b38a87afa3c31502a6696052a7395163.png


How can I get actual NDVI values?


How can I get actual NDVI values? You will have to use 32-bit float image type (as uint8 and uint16 types only support integers).


and

198f5a8b2d447379e96d1fe56fdbf333f1dfad4d.pngsentinel-hub.com
d3714e73b38a87afa3c31502a6696052a7395163.png


How can I create EO products?


How can I create EO products? Follow the steps described here.


I created a new layer called NDVI-INDEX in your instance, so that you can try:
http://services.sentinel-hub.com/ogc/fis/e814485d-2d6f-MASKED?LAYER=NDVI-INDEX&CRS=CRS%3A84&TIME=2015-01-01%2F2019-2-25&BBOX=13.522797,48.985135,13.524106,48.984322&RESOLUTION=10&MAXCC=5&ATMFILTER=NONE


I hope this helps?


Hi, Thank you for your reply, anyway, there is still mistake, look at the values of Vegetation Index and also on mix/max/st. deviation. This is not corresponding with the values in EO Browser (and you can not get st. dev. all zeros). I have tried your URL here:


And this is what I get from the EO for the same area (there is different mean/min/max values). And also, if you select 0 % clouds in EO and in URL (MAXCC=0), you get different number of scenes.


Hi, sorry, my mistake, the values of mean are corresponding. But If I use URL, for all values (MIN=MAX=MEAN) I get only NDVI mean from the area 🙂 Please, can you prepare for me the same layer for Moisture Index (not values for visualization of the layer, but the values of the Moisture Index) as you prepared for NDVI in my Configuration Utility? Thanks a lot!


The reason, why MIN and MAX are the same as MEAN is probably due to the fact that your area is extremely small, e.g. only one pixel.


For moisture index do follow instructions available here:
https://www.sentinel-hub.com/faq/how-create-eo-product


You will find script for Moisture index here:
github.com

sentinel-hub/custom-scripts/blob/master/sentinel-2/moisture_index/scripts.js


if (B8A == 0 || B11 == 0){
return [0,0,0];
} else {
var val = (B8A - B11)/(B8A + B11);

var vmin = -0.8;
var vmax = 0.8;
var dv = vmax - vmin;

var r = 0.0;
var g = 0.0;
var b = 0.0;


var v = val;

if (v < vmin){
v = vmin;
}
if (v > vmax){


This file has been truncated. show original


the first four lines are actual calculation of the index, the rest is for visualization.

So in your case the script would be:

if (B8A == 0 || B11 == 0){

return [0];

} else {

var val = (B8A - B11)/(B8A + B11);

return [val];


Hi, Thank you very much!!!


Hello. Please help me. MIN, MAX in graphic values the NDVI?


Reply