The major part of a “delay” is a matter of processing at ESA ground stations so you should revert this question to them (support@copernicus.eu). If you get a response, we would certainly appreciate a follow up info.
Based on our non-scientific observations cca. 50% L1C products are available on SciHub 6-12 hours after acquisition , cca 25% up to 24 hours and the rest later.
For L2A I think that ESA is waiting for most of the orbit to be processed (to L1C), before it starts with Sen2Cor. I read somewhere that delay is about 2 days after L1C.
After data is available on SciHub, it takes on average 1 hour to copy it to AWS (in/after the periods of SciHub problems this time may be prolonged)
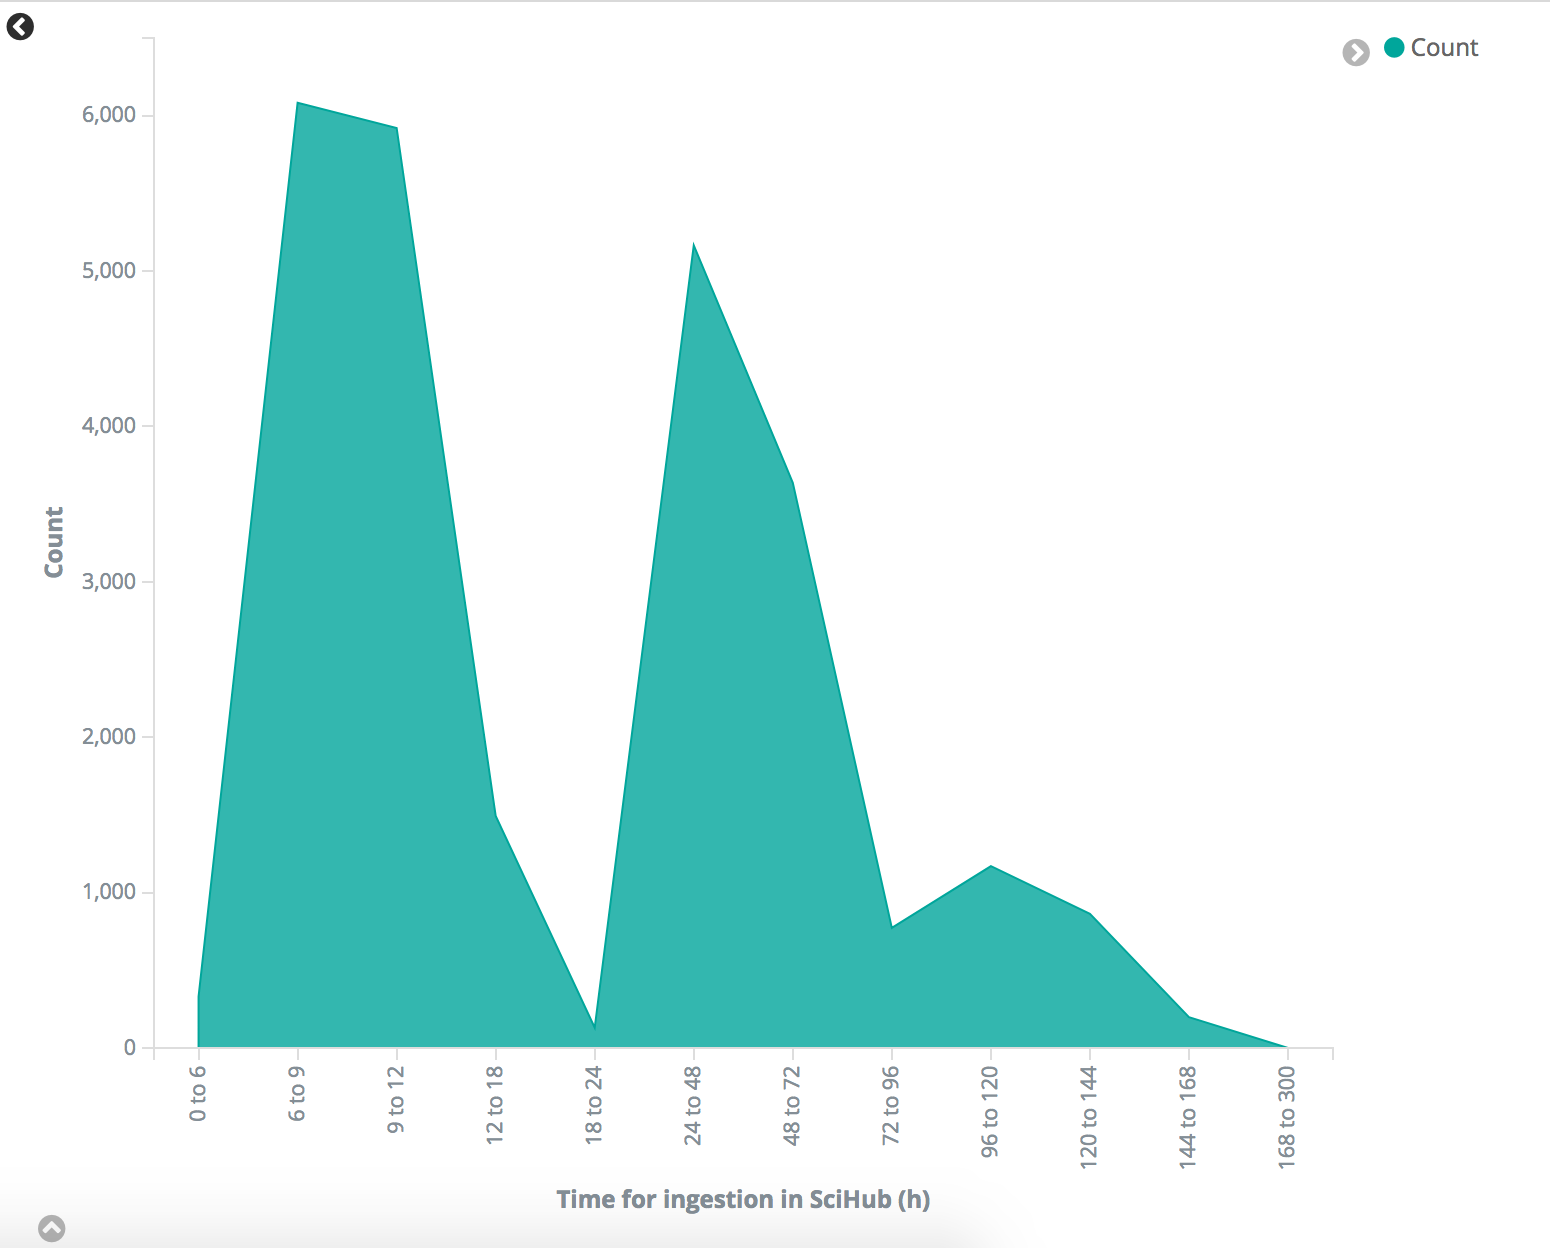
I took some time and analysed cca. 26.000 L1C products ingested in last 2 days. The results are unfortunately far from what we were hoping for:
(cca)
12.000 products have been ingested in under 12 hours
-1.600 in 12-24 hours
-5.100 in 1-2 days
-3.600 in 2-3 days
-700 in 3-4 days
-2.200 more than 4 days (these are probably related to Open Access Hub)
Thank you for the reply, I can’t open the link somehow (system is not allowing me). Would you know how these product scales (xx.00 formats) is aligned with level 1C to 2A transfer process.
Not sure I understand your question. The chart above is for L1C products only and it shows, how long it takes from when satellite acquires the image to when the image is available in SciHub.
Just dusting off this topic. I’m in the early days of ramping up on accessing Sentinel data and am especially interested in the frequency of availability (and/or processing delay) for either L1c (and/or L2a) for both AWS and Google. Are there any references to either the planned latencies for the data pipeline, or better yet something like the chart included earlier in this thread on the actual metrics?
ESA inproved quite a bit and if there is no outage (which still happens a couple of times a month) data come in 3-12 hours to scihub.
How long it takes to ingest them to AWS is another magic… if evertyhing goes well, it takes 30-90 minutes on average. But sometimes there is low bandwith…
For Google I do not have info bit last time I was checking their catalogue was not complete. Probably they skip older non-ingested products after SciHub outages… but this might have changed
Thanks for your very prompt and helpful reply. It sounds like an opportunity for a small script to start collecting the metrics to document the behavior.
For AWS you could even do it for the archive as productInfo.jaon includes all relevant data.
Looking forward
Was going to say you could look at the S3 timestamp but the fact that all this is in productInfo is very cool!
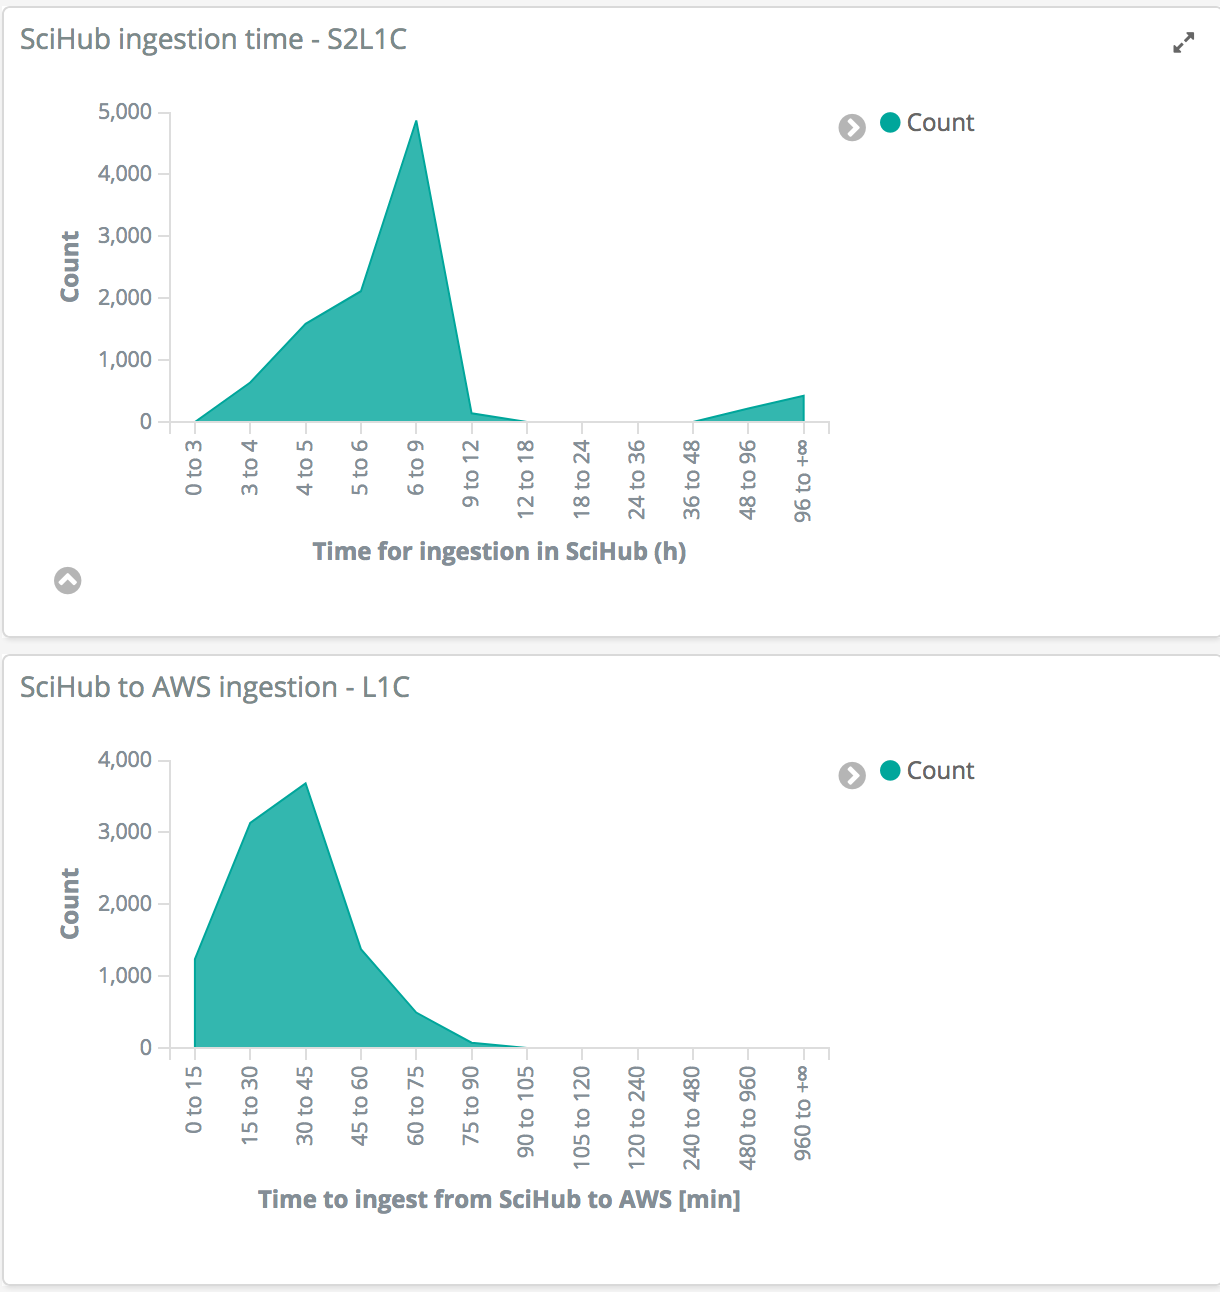
Find the chart for the last 24 hours of L1C, the above one is delay on SciHub side (acquisition to availability) and the bottom one delay between availability on SciHub and AWS S3.
support@copernicus.eu
Very nice charts to get an idea about latency. I s there a way of calculating that for a certain area of interest?
You can analyse all productInfo.json files in your chosen granule, all info are there.