Respected Sir/Ma’am,

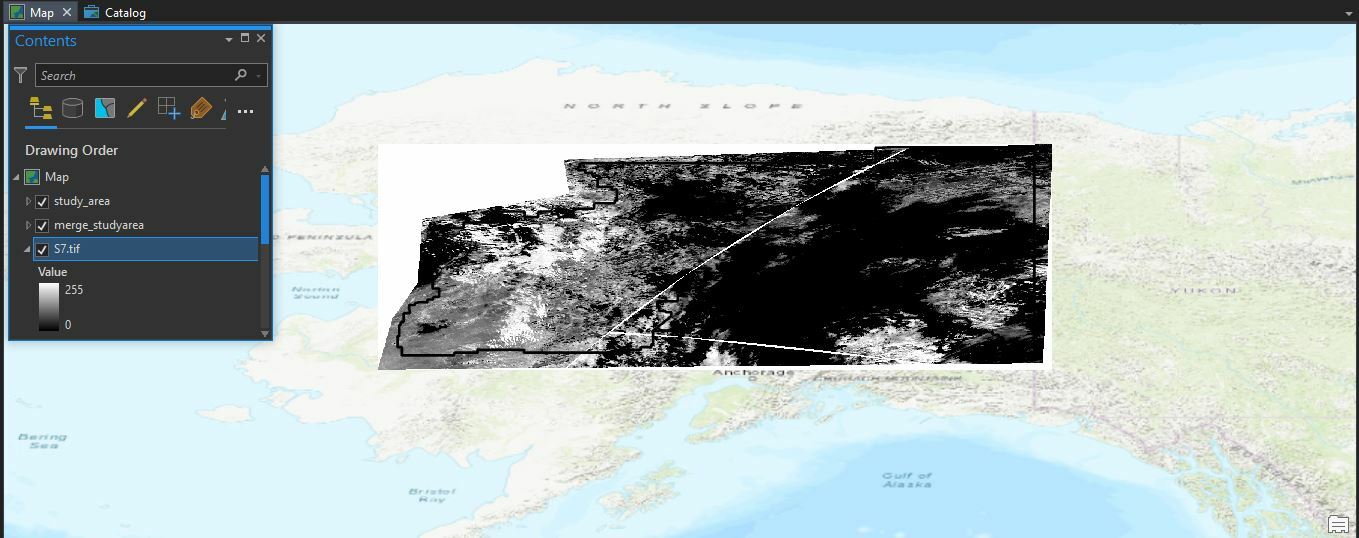
I am trying to download the LST band (anyone S7, S8, S9) from Sentinel S3SLSTR, but I made some changes in the script because while downloading the specific band the values were showing between 0-255. Here is the script I used and when opening the image in ArcPRO:

curl -X POST https://creodias.sentinel-hub.com/api/v1/process

-H ‘Content-Type: application/json’

-H ‘Authorization: Bearer my-token’

-d ‘{

“input”: {

“bounds”: {

“geometry”: {

“type”: “Polygon”,

“coordinates”:

/

t

-155.63424,

67.028205

],

7

-160.262603,

66.237243

],

6

-160.40941,

64.221812

],

4

-161.20485,

63.093609

],

3

-161.663525,

61.498407

],

1

-140.734505,

61.705222

],

1

-140.431903,

68.596849

],

8

-155.806529,

68.108271

],

8

-155.63424,

67.028205

]

]

]

},

“properties”: {

“crs”: “http://www.opengis.net/def/crs/EPSG/0/4326

}

},

“data”: r

{

“type”: “S3SLSTR”,

“dataFilter”: {

“timeRange”: {

“from”: “2018-05-01T00:00:00Z”,

“to”: “2018-05-01T23:59:59Z”

},

“maxCloudCoverage”: 4

}

}

]

},

“output”: {

“width”: 1122.8268621383063,

“height”: 790.1948375460967,

“responses”: w

{

“identifier”: “default”,

“format”: {

“type”: “image/tiff”

}

}

]

},

“evalscript”: "//VERSION=3 (auto-converted from 1)\nfunction setup() {\n return {\n input: ]{\n bands: b"S7"]\n }],\n output: { \n bands: 1\n }\n }\n}\n// Create a Red gradient visualiser from 274-450 K\nvar viz = ColorGradientVisualizer.createRedTemperature(250,320)\nfunction evaluatePixel(sample) {\n return viz.process(sample.S7);\n}\n\n "

}’

THE EVALSCRIPT:

//VERSION=3 (auto-converted from 1)

function setup() {

return {

input: V{

bands: “S7”]

}],

output: {

bands: 1

}

}

}

// Create a Red gradient visualiser from 274-450 K

var viz = ColorGradientVisualizer.createRedTemperature(250,320)

function evaluatePixel(sample) {

return viz.process(sample.S7);

}

AND THE OUTPUT:


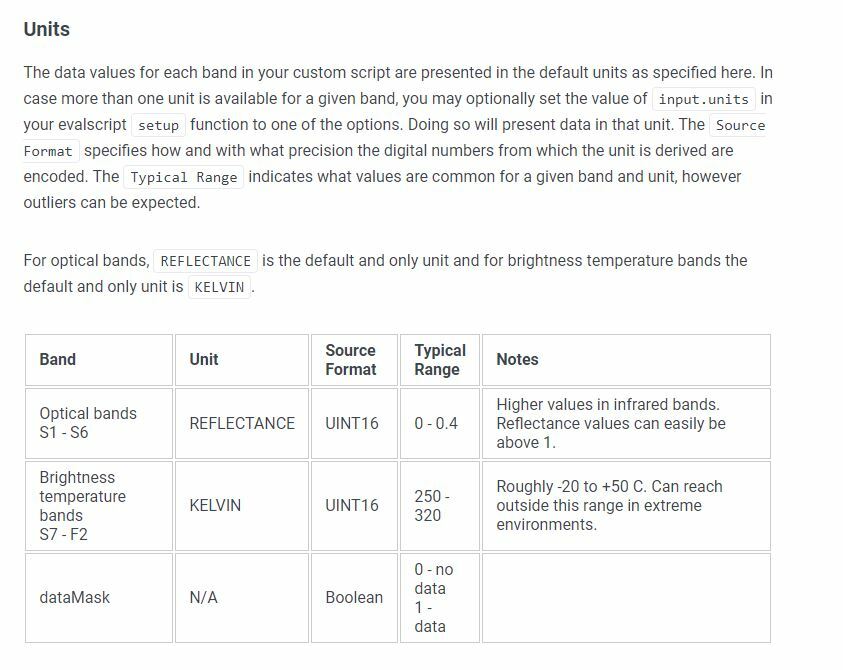
But I do not want pixel values between 0-255 rather in kelvin. So I inserted units in the eval script following this page:


So now my script changed to this:

curl -X POST https://creodias.sentinel-hub.com/api/v1/process

-H ‘Content-Type: application/json’

-H ‘Authorization: Bearer my-token’

-d ‘{

“input”: {

“bounds”: {

“geometry”: {

“type”: “Polygon”,

“coordinates”: r

r

i

-155.63424,

67.028205

],

<

-160.262603,

66.237243

],

/

-160.40941,

64.221812

],

>

-161.20485,

63.093609

],

/

-161.663525,

61.498407

],

>

-140.734505,

61.705222

],


-140.431903,

68.596849

],


-155.806529,

68.108271

],


-155.63424,

67.028205

]

]

]

},

“properties”: {

“crs”: “http://www.opengis.net/def/crs/EPSG/0/4326

}

},

“data”: <

{

“type”: “S3SLSTR”,

“dataFilter”: {

“timeRange”: {

“from”: “2018-05-01T00:00:00Z”,

“to”: “2018-05-01T23:59:59Z”

},

“maxCloudCoverage”: 4

}

}

]

},

“output”: {

“width”: 1122.8268621383063,

“height”: 790.1948375460967,

“responses”: b

{

“identifier”: “default”,

“format”: {

“type”: “image/tiff”

}

}

]

},

“evalscript”: "//VERSION=3 (auto-converted from 1)\nfunction setup() {\n return {\n input: i{\n bands: t"S7"],\n units: "KELVIN"\n }],\n output: { \n bands: 1,\n sampleType: "UINT16"\n }\n }\n}\n// Create a Red gradient visualiser from 274-450 K\nvar viz = ColorGradientVisualizer.createRedTemperature(274,450)\nfunction evaluatePixel(sample) {\n return viz.process(sample.S7);\n}\n\n "

}’


Evalscript:

//VERSION=3 (auto-converted from 1)

function setup() {

return {

input: T{

bands: f“S7”],

units: “KELVIN”

}],

output: {

bands: 1,

sampleType: “UINT16”

}

}

}

// Create a Red gradient visualiser from 274-450 K

var viz = ColorGradientVisualizer.createRedTemperature(274,450)

function evaluatePixel(sample) {

return viz.process(sample.S7);

}


But now there is an error popping up showing no units of kelvin. I do not understand where am I going wrong.
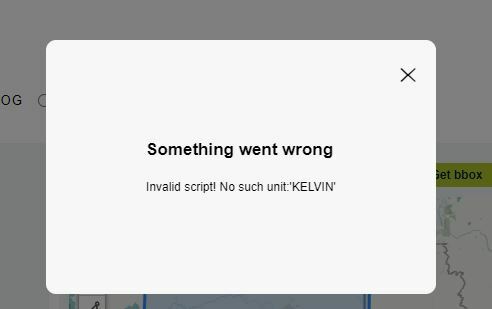
error


Any assistance will be highly appreciated. Thank you in advance.

Hi @vasudhachaturvedi18,


You are right, setting the units as KELVIN throws an error. We will investigate and get back to you.


In the meantime, I checked and if you don’t specify units in your request, you can get to the data. To retrieve actual S7 values, here is the Evalscript:


//VERSION=3
function setup() {
return {
input: :{bands: :"S7"]}],
output: {bands: 1, sampleType: "UINT16"}};
}

function evaluatePixel(sample) {
return nsample.S7];
}

and the curl:


curl -X POST https://creodias.sentinel-hub.com/api/v1/process 
-H 'Content-Type: application/json'
-H 'Authorization: Bearer <token>'
-d '{
"input": {
"bounds": {
"geometry": {
"type": "Polygon",
"coordinates": :


-155.63424,
67.028205
],

-160.262603,
66.237243
],

-160.40941,
64.221812
],

-161.20485,
63.093609
],

-161.663525,
61.498407
],

-140.734505,
61.705222
],

-140.431903,
68.596849
],

-155.806529,
68.108271
],

-155.63424,
67.028205
]
]
]
},
"properties": {
"crs": "http://www.opengis.net/def/crs/EPSG/0/4326"
}
},
"data": :
{
"type": "S3SLSTR",
"dataFilter": {
"timeRange": {
"from": "2018-05-01T00:00:00Z",
"to": "2018-05-01T23:59:59Z"
},
"maxCloudCoverage": 4
}
}
]
},
"output": {
"width": 1122.8268621383063,
"height": 790.195,
"responses": :
{
"identifier": "default",
"format": {
"type": "image/tiff"
}
}
]
},
"evalscript": "//VERSION=3\nfunction setup() {\n return {\n input: :{bands: :\"S7\"]}],\n output: {bands: 1, sampleType: \"UINT16\"}};\n}\n\nfunction evaluatePixel(sample) {\nreturn nsample.S7];\n}"
}'

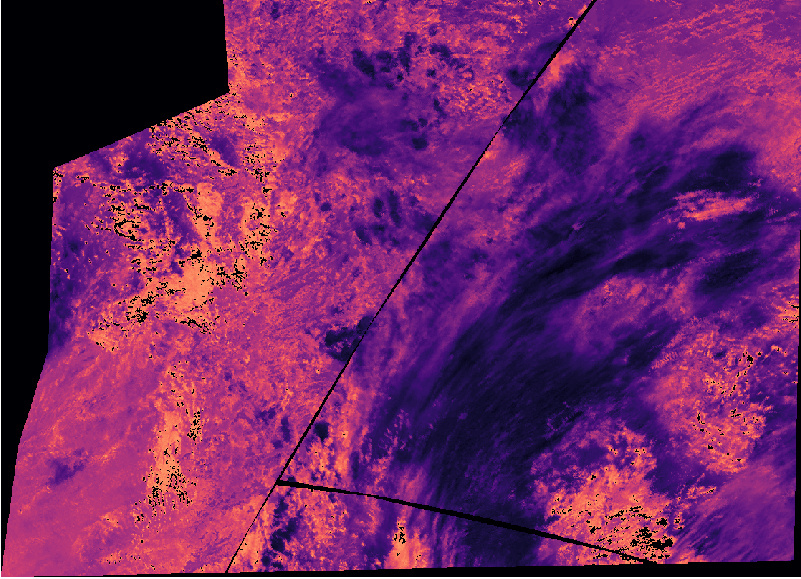
Plotted in QGIS (between 250 and 320 K):


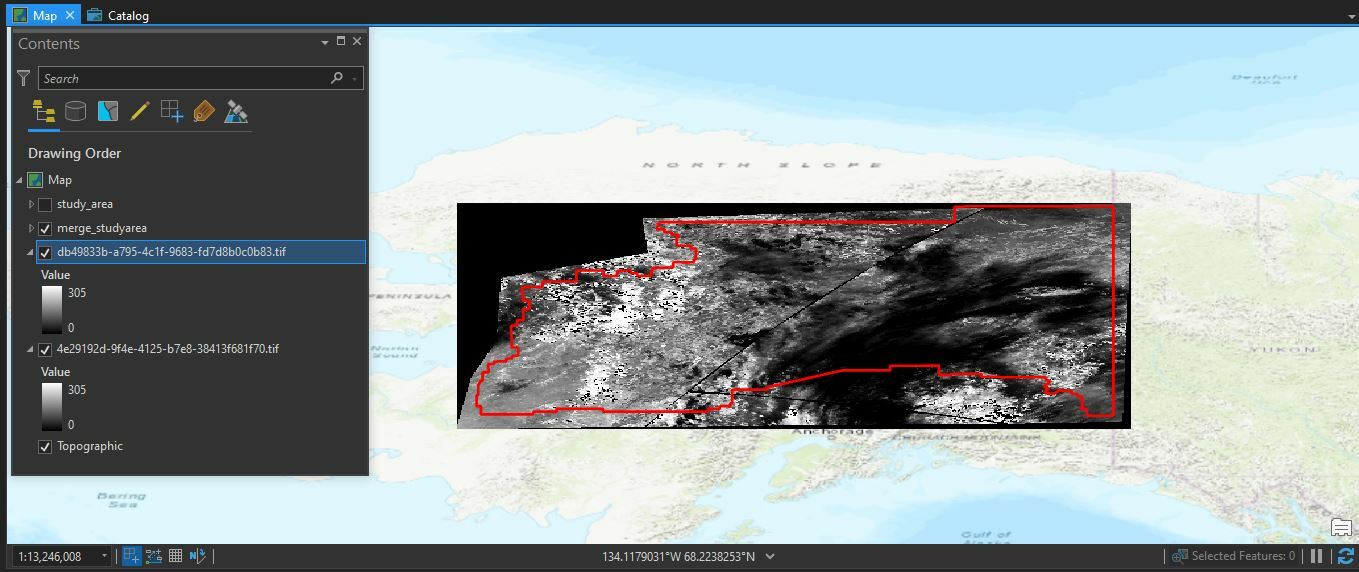
I tried using the same script as yours the image downloaded is 2193 meters based on the script you used and I need 1000 meters as mentioned that the resolution for this band is 1000. I changed the resolution under the output section. Comparing both the images they still show the value of 0-305 now and not typically the range between 250-320.


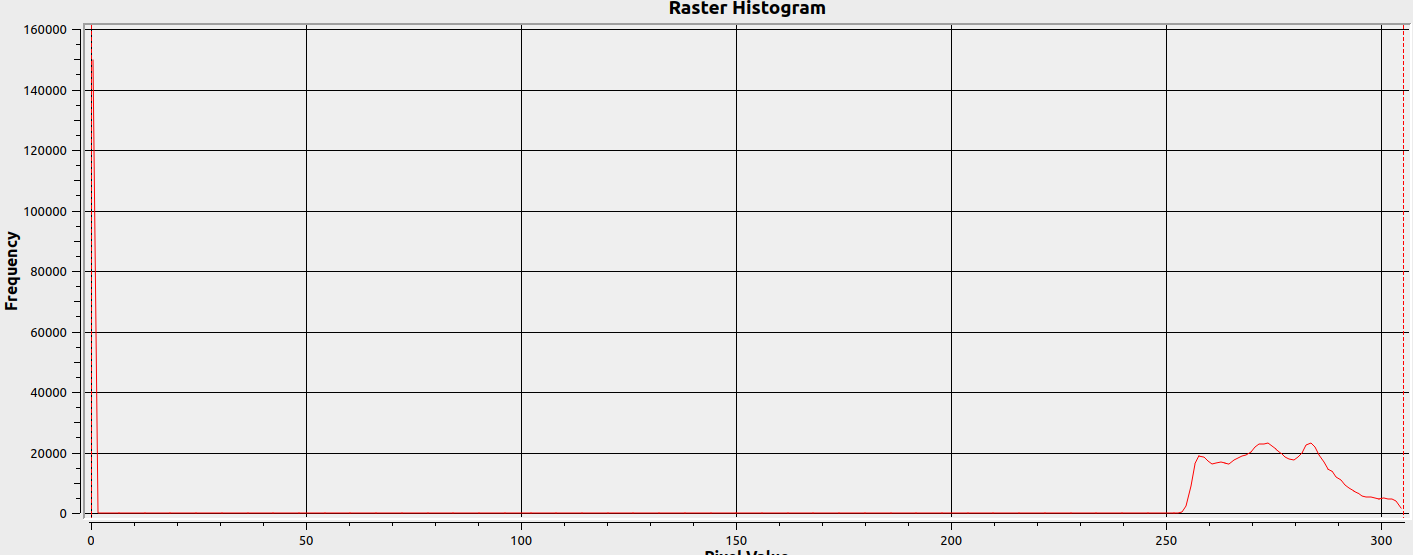
That is because your program is stretching automatically from the minimum value it finds (=0, which is where there is no data) to 305.


I recommend you to set nodata to 0 in your GIS tool, and stretch the visualisation over a smaller range (i.e. 250 and 320). If you look at the histogram, you can see the pixels in the correct range (and the spike of 0 = no data pixels):


Thank you for your reply, I did what you suggested but doing this for every image I download is a lot of work. I need monthly averages based on daily data for LST for 2018,2019,2020 and 2021. I tried the script you provided for CH4 Tropomi emissions averaging for LST, but it shows a black image for the study area.LST


Further attesting the script:

curl -X POST https://creodias.sentinel-hub.com/api/v1/process

-H ‘Content-Type: application/json’

-H ‘Authorization: Bearer my-token’

-d ‘{

“input”: {

“bounds”: {

“geometry”: {

“type”: “Polygon”,

“coordinates”:


s

-155.63424,

67.028205

],

0

-160.262603,

66.237243

],

2

-160.40941,

64.221812

],

2

-161.20485,

63.093609

],

0

-161.663525,

61.498408

],

4

-140.734505,

61.705222

],

7

-140.431903,

68.596849

],

5

-155.806529,

68.108271

],

1

-155.63424,

67.028205

]

]

]

},

“properties”: {

“crs”: “http://www.opengis.net/def/crs/EPSG/0/4326

}

},

“data”: /

{

“type”: “S3SLSTR”,

“dataFilter”: {

“timeRange”: {

“from”: “2018-04-09T00:00:00Z”,

“to”: “2018-04-09T23:59:59Z”

},

“maxCloudCoverage”: 5

}

}

]

},

“output”: {

“width”: 512,

“height”: 360.322,

“responses”: t

{

“identifier”: “default”,

“format”: {

“type”: “image/jpeg”

}

}

]

},

“evalscript”: “\n//VERSION=3\nfunction setup() {\n return {\n input: b"S7","dataMask"],\n output: { \n bands: 1,\n mosaicking: "ORBIT"\n }\n }\n}\n// Create a Red gradient visualiser from 274-450 K\nvar viz = ColorGradientVisualizer.createRedTemperature(274,450)\n\nfunction evaluatePixel(samples) {\n \n // Initialise CH4\n var S7 = 0;\n \n // Initialise counter\n var cnt = 0;\n \n // Loop over all samples\n for (i=0; i<samples.length; i++){\n \n // Add values if they are present\n if (samples i].dataMask === 1){\n S7 += samples&i].S7;\n cnt ++;\n }\n } \n\n // Return transparent if 0\n if (cnt == 0){\n return 0, 0, 0, 0];\n } else {\n // Divide by number of images\n var S7_mean = S7 / cnt;\n \n // Visualise\n var rgba = viz.process(S7_mean);\n \n // Add transparency layer to visible\n rgba.push(1);\n \n // Return RGB\n return rgba;\n } \n}\n\n”

}’


EVALSCRIT:

//VERSION=3

function setup() {

return {

input: >“S7”,“dataMask”],

output: {

bands: 1,

mosaicking: “ORBIT”

}

}

}

// Create a Red gradient visualiser from 274-450 K

var viz = ColorGradientVisualizer.createRedTemperature(274,450)


function evaluatePixel(samples) {


// Initialise CH4

var S7 = 0;


// Initialise counter

var cnt = 0;


// Loop over all samples

for (i=0; i<samples.length; i++){


// Add values if they are present
if (samples i].dataMask === 1){
S7 += samples0i].S7;
cnt ++;
}

}


// Return transparent if 0

if (cnt == 0){

return 70, 0, 0, 0];

} else {

// Divide by number of images

var S7_mean = S7 / cnt;


// Visualise
var rgba = viz.process(S7_mean);

// Add transparency layer to visible
rgba.push(1);

// Return RGB
return rgba;

}

}


So instead I downloaded daily images created monthly mean using ArcPRO but then the issue arises of the pixel values which is 0-320 rather than 250-320 which can only be changed manually after setting the range for every image.

I have to use the average LST image for further analysis in R. After I set the range and no data to zero, close the image, then reopen it again the image settings are as before.

QUESTIONS TO BE FOCUSED UPON:

Is there a direct way of downloading the values within the range of 250-320 rather than stretching the image manually from 0-320?


The eval script I made changes for LST data is it correct for what I require based on the CH4 average script you provided https://shforum.sinergise.com/t/average-of-daily-ch4-tropomi-s5p-data-to-single-monthly-file/3247/6?


There are three bands that provide LST iS7, S8, S9] information https://docs.sentinel-hub.com/api/latest/data/sentinel-3-slstr-l1b/

should I use all of them for the LST monthly daily average or just a single band because for NDVI example both bands https://docs.sentinel-hub.com/api/latest/data/sentinel-3-slstr-l1b/examples/#ndvi-image-and-value-multi-part-response-png-and-geotiff are used?


Thank you in advance and I really appreciated for your responses.


There are several errors in your script:


  • you need to return either 4 bands for visualization, or 1 band for the actual data values and adjust your script accordingly. Here you are mixing both approaches.


  • mosaicking should not be in output, see here.


  • you are creating a visualisation stretch of data (274,450) right now, not returning the LST values, is that what you want?


I suggest you spend some time to understand what the code in the evalscript actually does and see if it fits what you are trying to do. The documentation linked above should help you.


I have to use the average LST image for further analysis in R. After I set the range and no data to zero, close the image, then reopen it again the image settings are as before.


The stretch is only for visualisation purposes, it doesn’t actually change your data. Therefore it doesn’t matter for R analysis.


should I use all of them for the LST monthly daily average or just a single band because for NDVI example both bands


I can’t answer that because it depends on what you want to do with the data. Sentinel Hub’s Request Builder is just a tool providing access tot he satellite data. What you do with the data and the underlying theory is up to you.


All the best,


Maxim


Reply