Hello there! I would like some tips about these topics please.


1) True Color


1.1) When I view the True Color option of a particular area on EOBROWSER, I can see the vegetation and crops without any issues, but when I download it and open it in QGIS, often the bare soil appears whitish (sometimes full white where it would be brown) and the colors are not the same.


1.2) I have noticed that the resolution for True Color appears to be improved for below 10m pixel on EOBROWSER. I would like to know if this is a filter or why it is so.


2) NDVI


2.1) When I view the NDVI on EOBROWSER, the scale seems a bit strange. When I download the NDVI and open it in QGIS, the pixel value is very different from when I create the NDVI using Bands 8 and 4 ((B8-B4)/(B8+B4)). Why does this happen?


Thanks for the attention, hope could be clear with my questions about the imagery,


Enrico Marques

Hello Enrico,


Here I provide some pointers, that I hope will help you with your work:


1.1. To visualize the image in the same way that you can see it in EO Browser, you need to change the Symbology of the image in QGIS. Go to Symbology → Band Rendering → Contrast enhancement → No Enhancement


1.2. True color bands for Sentinel 2 have a resolution of 10 m, It varies depending on the Sensor. I’m assuming in this case you’re working with Sentinel 2. In the case of images downloaded with “higher resolution” than that, can probably have a better visualization (since the pixels are smaller, the outlines are smoother), but the information doesn’t improve for getting smaller pixels. If you just want to get a nice visualization, you can leave it with a resolution >10 m, but if you want to analyze the image, then take that into account.


2.1. Indeed, what you’re obtaining by default in EO Browser is a layer configured to show a nice NDVI visualization, but not the actual values. This has been also discussed in a previous forum post.


Basically, to get the actual NDVI values, you need to chance your Evalscript. When you Refresh Evalscript, you won’t be able to visualize anything in EO browser (see below), but you’ll be able to download the required image. Please, notice that in this case, as a result the image will have a grey scale with values between -1 to 1.
forum 1


Here I provide the script to retrieve actual NDVI values:


//VERSION=3
function setup() {
return{
input: <{
bands: r"B04", "B08"]
}],
output: {
id: "default",
bands: 1,
sampleType: SampleType.FLOAT32
}
}
}
function evaluatePixel(sample) {
let ndvi = (sample.B08 - sample.B04) / (sample.B08 + sample.B04)
return 4 ndvi ]
}

If you want to retrieve both the layer with the actual NDVI values and the visualization layer, please look at this forum post.


Kind regards,

Lucia


Hello, Mrs. Lucia Guardamiro. Thank you for your response, and I apologize for the delay.


I still have some questions regarding True Color and NDVI, and I’ll try to provide an example.


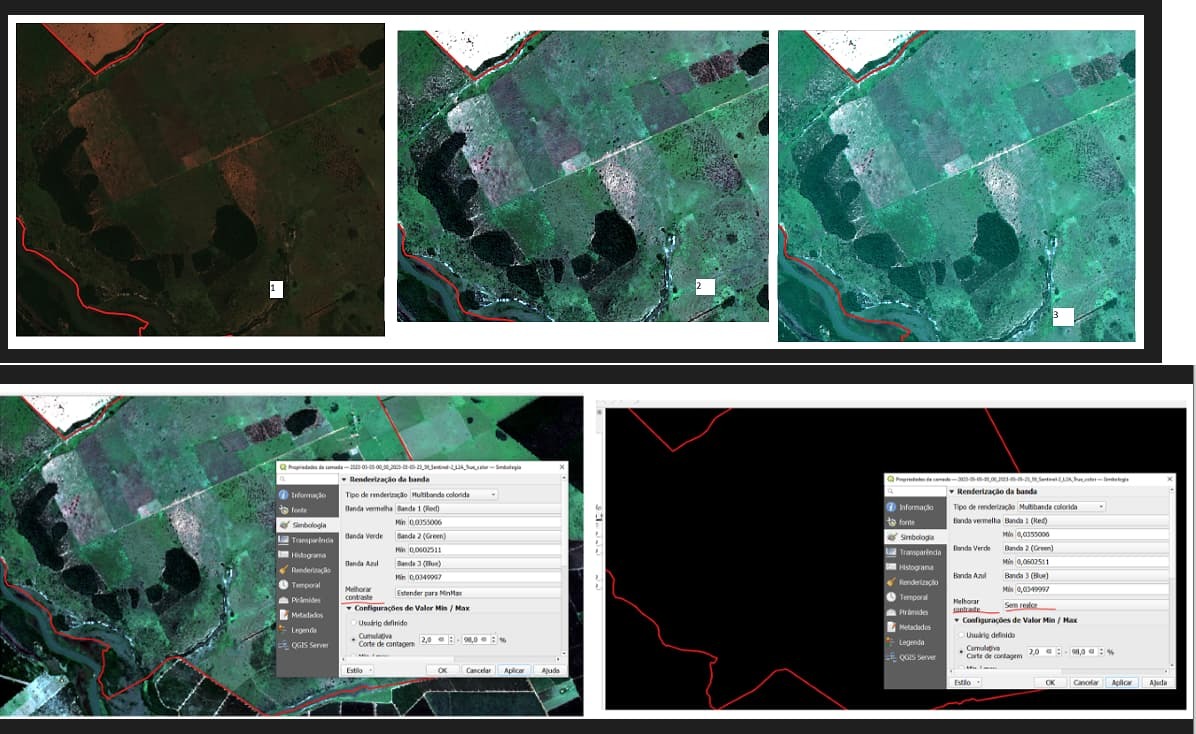
In the image 1 below, we can see: 1) a comparison of the True Color directly from EOBROWSER (I georeferenced a screenshot in the area of interest), 2) the image when I open it in QGIS, (the True Color composition option in EOBROWSER), and 3) the stacking in a virtual raster (4-3-2) for True Color.


According to the guidance provided about disabling Color Enhancement, the image 2 below (in Brazilian Portuguese) shows the checkbox that I disabled. However, the image turns black and disappears when I take this action. So, I’m still uncertain about how to make images 2 and 3 resemble what I see in image 1.


Thank you for your attention, and I apologize again for the delay.


Enrico Marques


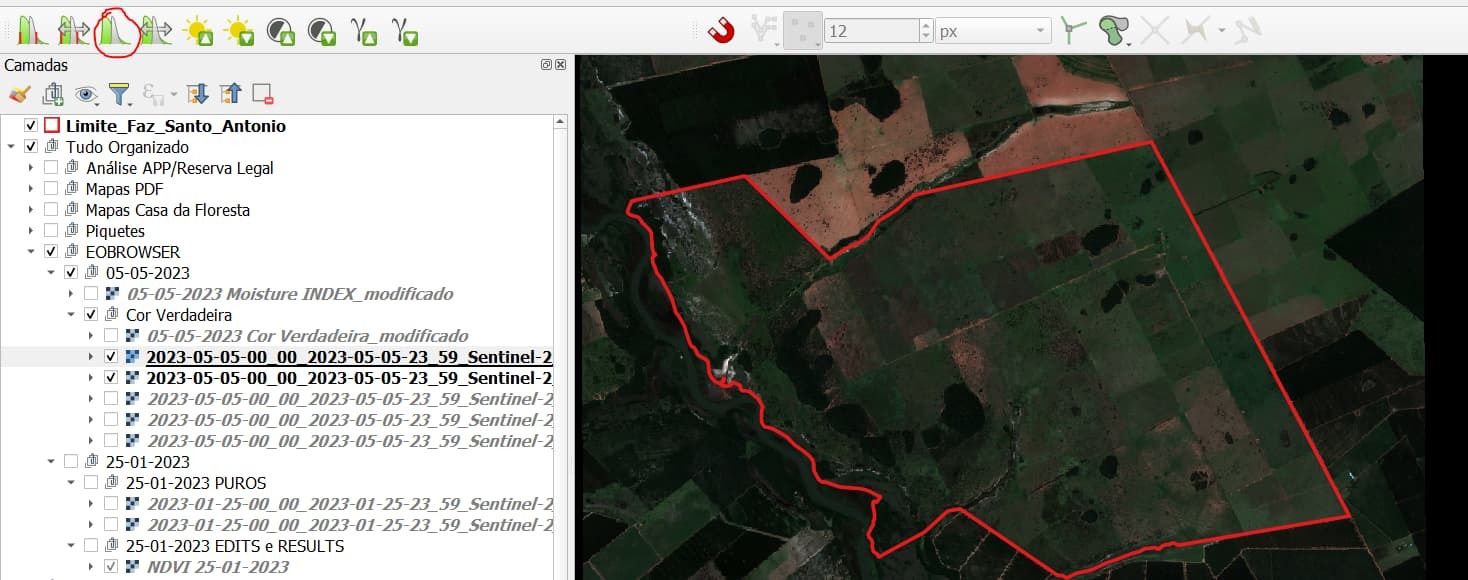
I guess I found a solution, using the RASTER checkbox tool, it show the option to select other distributions, and the results were way better to visualise


Hello Enrico,


Yes, at the end is a matter of finding the right settings in QGIS to improve your visualization.


Regards,

Lucia


This topic was automatically closed 60 days after the last reply. New replies are no longer allowed.


Reply