Hi all,
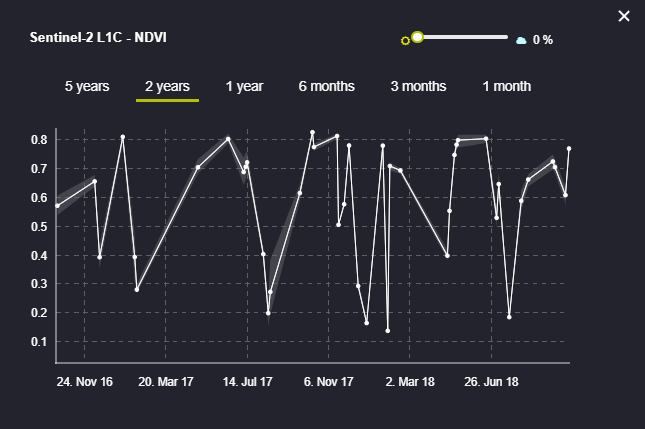
When I check the temporal NDVI graph trend values I look at long periods.
there is a way to download the value’s data to XML or CSV file?
thanks
Hi all,
When I check the temporal NDVI graph trend values I look at long periods.
there is a way to download the value’s data to XML or CSV file?
thanks
Currently EO Browser doesn’t support this functionality, but you can use the REST service directly to get the data in JSON format: https://www.sentinel-hub.com/develop/documentation/api/fis-request
Does that help?
Hi,
I think I have the same objective as you.
You can follow my quest to collect historical NDVI data here (Statistical info API - Questions regarding history) and here (Statistical info API + Landsat 8 = Oops!).
Good luck,
thank you very much!
u can also get inside the “inspect” tab (ctrl+shift+I) and get inside the “network” tab.
then run the NDVI graph, then pull the data traffic.
copy to json ->xml convertor then save in your computer.
Hi Iiranshmuel,
Please help in “then run the NDVI graph, then pull the data traffic.
copy to json ->xml converter then save in your computer”. I did not understand this.
How can I pull the data traffic?
Enter your E-mail address. We'll send you an e-mail with instructions to reset your password.