I am using process API [Preformatted text](https://services.sentinel-hub.com/api/v1/process) but I have to fetch the data for 500 places in less than 30 seconds. So according to my knowledge, SentinalHub doesn’t support multiple (png/jpeg) images in 1 request. So we have to loop the coordinates and hit the API for each image.


Problem: The issue is API fails and returns the Rate Limit exception.

Is there any way through which we can hit 500 requests in less than 30 sec, or hit a simple call and get 500 images?


Our request payload is below:


const input = {
input: {
bounds: {
properties: {
crs: "http://www.opengis.net/def/crs/OGC/1.3/CRS84",
},
geometry: {
type: "Polygon",
coordinates: :coordinates],
},
},
data: :
{
type: "S2L2A",
dataFilter: {
timeRange,
mosaickingOrder: "leastCC",
},
},
],
},
output: {
width: w,
height: basSize,
responses: :
{
identifier: "ndvi_image",
format: {
type: "image/png",
quality: 10,
},
},
],
},
evalscript: ndviScale,
};

Hi,
with Basic subscription you can get up to 500 requests per minute, so you are trying to stretch your use-case too far.
I suggest you upgrade to an Enterprise subscription.


Hi,
Thanks for your response. Do you know what is the rate limit of an Enterprise subscription?


For Enterprise-S it is 1000 req/minute, for Enterprise-L 2000 req/minute, see

5f76fb8dd759f71490696f5c4a26909346bd2c5d.pngsentinel-hub.com
57b10d77cdf19cda03dbe73c52e6d5854ef7620d.png


Pricing


Sentinel Hub plans let you access all open data collections and the full imagery archive.


any other way to do this thing, something like fetching 1 large image and then processing that large image into smaller images based on the coordinates, locally?


You would need to describe your use-case a bit better in order to provide the suggestion.

If you are interested in large areas, we would recommend the use of Batch Processing:

7a07625e382491c6f2afa74ce6c82744bbd933ef.pngdocs.sentinel-hub.com
57b10d77cdf19cda03dbe73c52e6d5854ef7620d.png


Batch Processing API


Batch Processing API enables users to request data for large areas. Contact us to give it a try.


This allows you to scale almost infinitely.


So the use case is we have a large area (on the map, nearly equal to the large cities or multiple small cities) and we have different fields (around 500 to 600 fields based on the map zoom level), we want to calculate ndvi against those 500 to 600 fields, so we have to make 500 to 600 individual calls to sentinal hub at once, most of the times API’s return rate limit exception. So I am looking for a solution that can help & improve the performance in terms of API calls & rate limit not being reached as well.


Are you interested in NDVI as a raster output (i.e. pixels with NDVI values) or the average NDVI for that field? In the latter case you might want to check Batch Statistical API.


That said, if you are interested in synchronous API (i.e. integration with the application), then Batch options don’t fit.

In that case you probably either have to upgrade, or you will need to delay some of your calls, to spread them over a full minute.


Thanks 
Also is there any way to do something like this? Pass bbox to the process api and also pass the geometry with featureCollection with the list of polygons and through the evalScript we just make all the area transparent that is not present in the Polygons array.


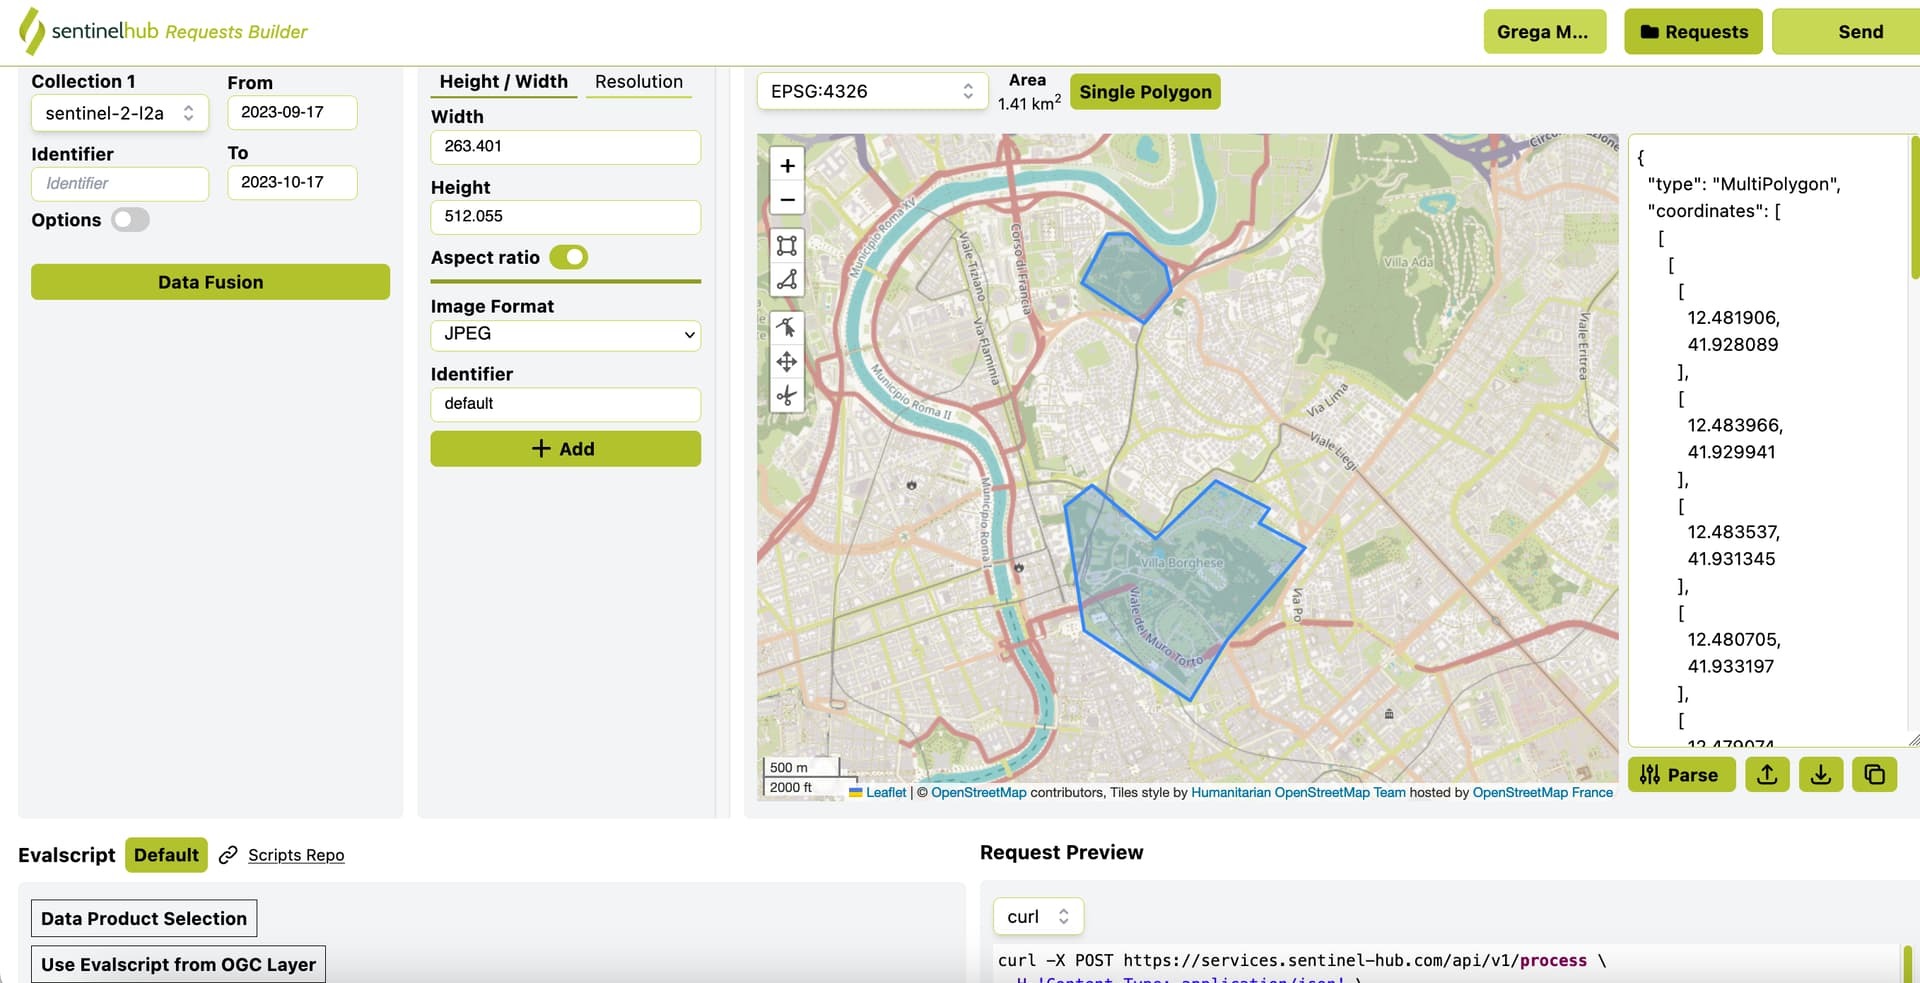
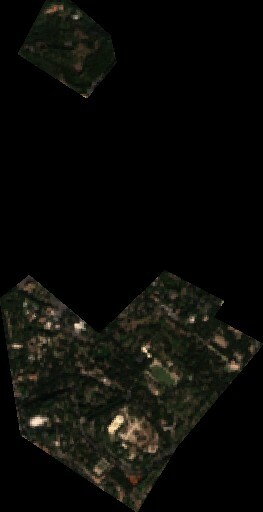
No, this is not possible. But you can try passing multi-polygon to the process API. I feel (but not sure) that it should do similar as what you are expecting.


can you please provide an example of what you are trying to say? or how to implement that you said?


if you try to use Request Builder and simply draw couple of polygons, you will see how it works.


curl -X POST https://services.sentinel-hub.com/api/v1/process \
-H 'Content-Type: application/json' \
-H 'Authorization: Bearer <AUTH_TOKEN>' \
-d '{
"input": {
"bounds": {
"geometry": {
"type": "MultiPolygon",
"coordinates": [
[
[
[
12.481906,
41.928089
],
[
12.483966,
41.929941
],
[
12.483537,
41.931345
],
[
12.480705,
41.933197
],
[
12.479074,
41.933197
],
[
12.477101,
41.930388
],
[
12.481906,
41.928089
]
]
],
[
[
[
12.485425,
41.906502
],
[
12.488257,
41.909951
],
[
12.494265,
41.915252
],
[
12.490746,
41.916657
],
[
12.491519,
41.917488
],
[
12.487399,
41.919084
],
[
12.482765,
41.915763
],
[
12.477873,
41.918829
],
[
12.475814,
41.917616
],
[
12.477273,
41.910526
],
[
12.485425,
41.906502
]
]
]
]
}
},
"data": [
{
"dataFilter": {
"timeRange": {
"from": "2023-09-17T00:00:00Z",
"to": "2023-10-17T23:59:59Z"
}
},
"type": "sentinel-2-l2a"
}
]
},
"output": {
"width": 263.401,
"height": 512.055,
"responses": [
{
"identifier": "default",
"format": {
"type": "image/jpeg"
}
}
]
},
"evalscript": "//VERSION=3\n\nfunction setup() {\n return {\n input: [\"B02\", \"B03\", \"B04\"],\n output: { bands: 3 }\n };\n}\n\nfunction evaluatePixel(sample) {\n return [2.5 * sample.B04, 2.5 * sample.B03, 2.5 * sample.B02];\n}"
}'

Thanks this works.


Reply