Hi I am very new to SentinelHub, great tool for quick satellite data visualization!
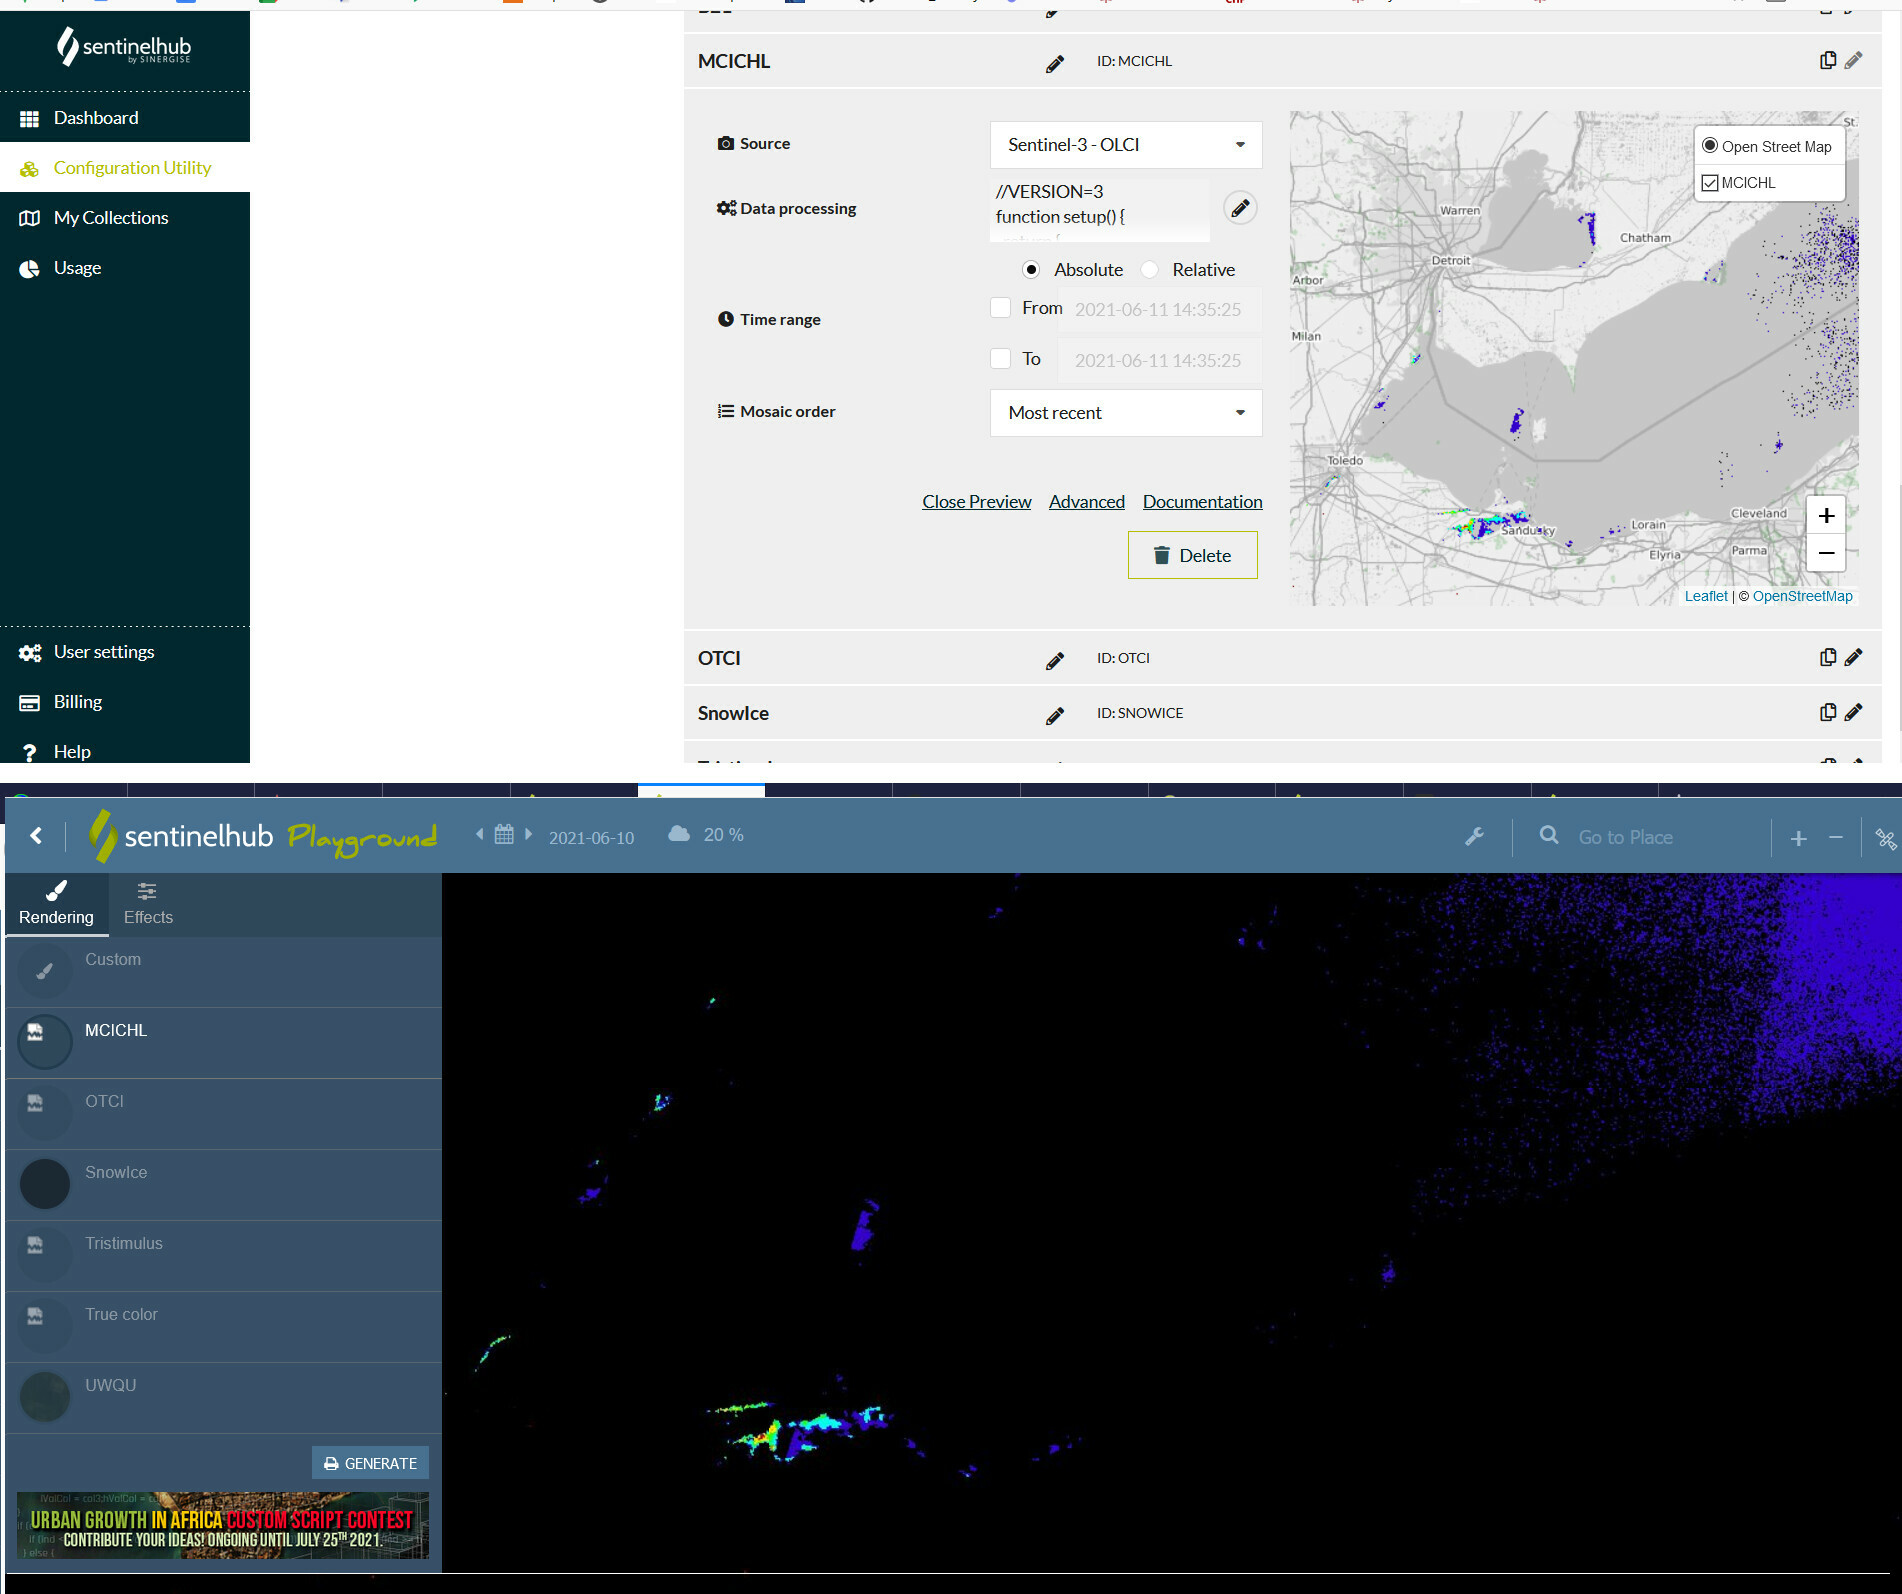
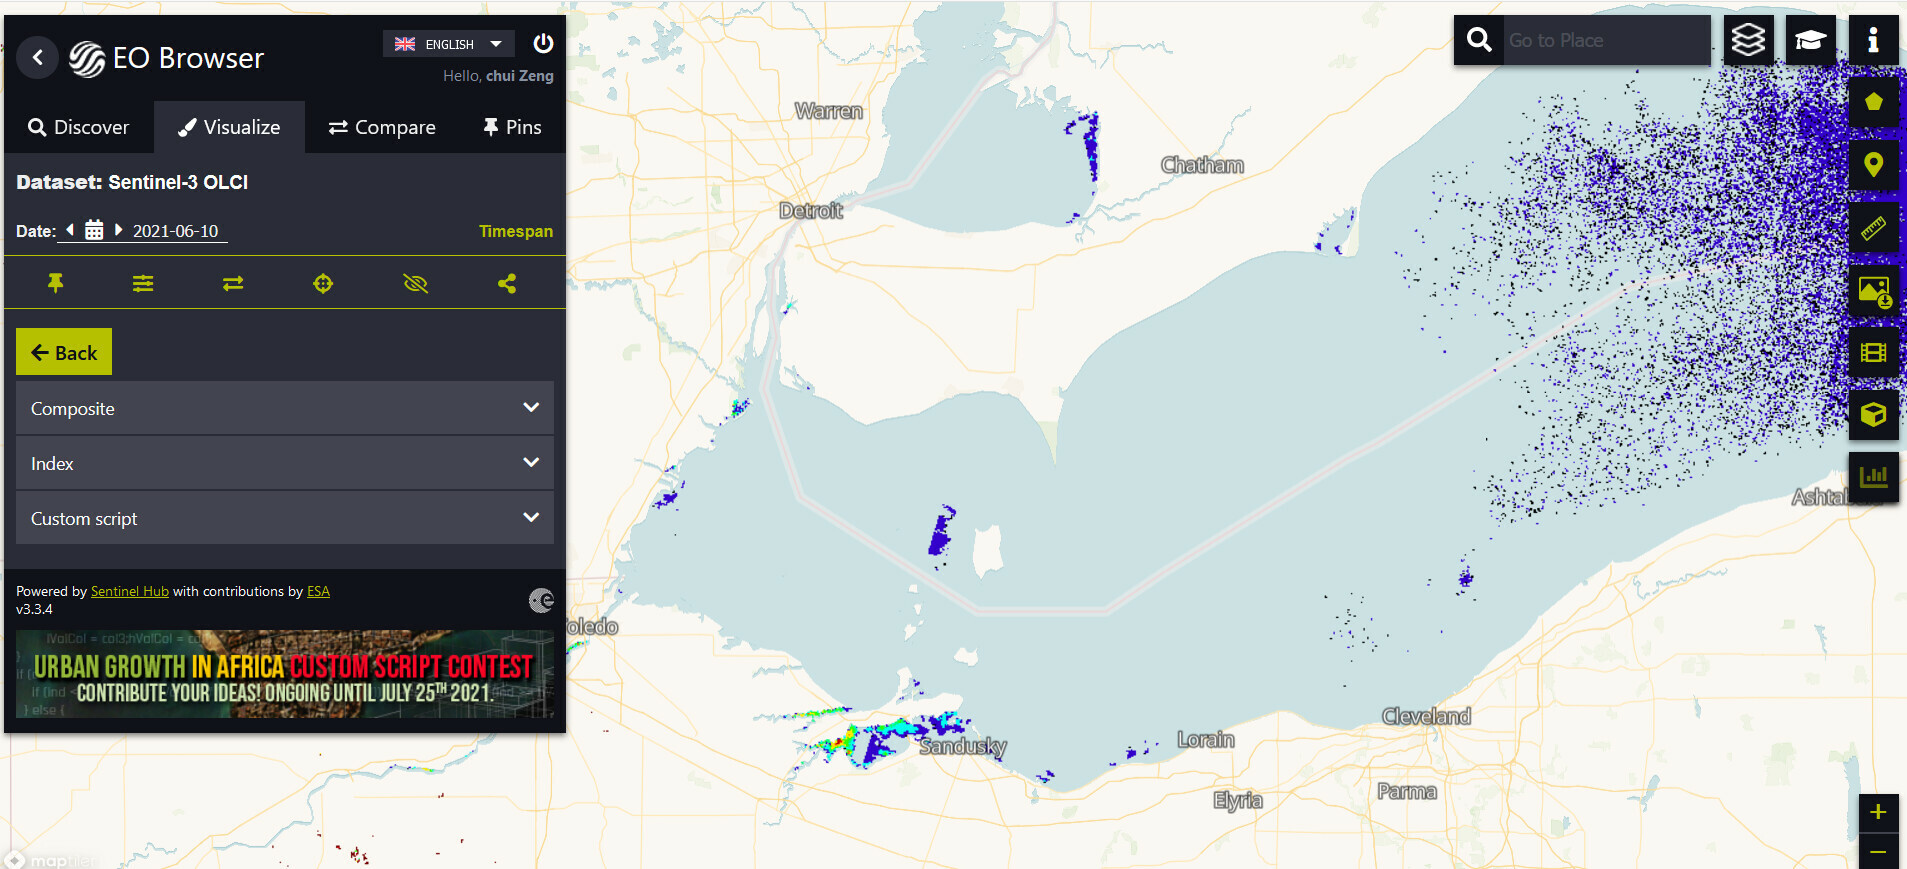
I tried to build an example using Sentinel-3 OLCI, but notice I received different map mask views from the “Dashboard–>Preview” and Playground. The script I used to build the customized band at the end of this post.
Screenshots of my different outputs:
top: in “Dashboard—Band preview” (correctly mask land and unrelated water)
bottom: the same band in “Playground” (incorrect, all background is black)
the script I used for the band configuration is:
    //VERSION=3
//based on the sentinel-3 OLCI template
function setup() {
  return {
    input: [{
      bands:["B10", "B11", "B12", "dataMask"],
      units: "REFLECTANCE" // default value
    }],
    output: {
      id: "default",
      bands: 4,
      sampleType: "AUTO"
    }
  }
}
var cm=new ColorMapVisualizer([
[0, [0,	0,	0     ]],
[0.1,[0.2,	0,	0.8     ]],
[5, [0,	1,	0.937254902  ]],
[10,[0,	1,	0.466666667  ]],
[15,[0.188235294,	1	,0]],
[20,[1,	0.92156862,	0    ]],
[25,[1,	0.37254902,	0    ]],
[30,[0.843137255,	0,	0]],
[35,[0.68627451,	0,	0]],
[40,[0.450980392,	0,	0]]
  ]);

function evaluatePixel(sample) {
    var idx= sample.B11-sample.B10-(709-681)/(751-681)*(sample.B12-sample.B10);
    var chl = 1457 * idx+ 2.895;
  	val=cm.process(chl);
    val.push(sample.dataMask *(chl > 0) );  //add the 4th channel
    return val
  }


