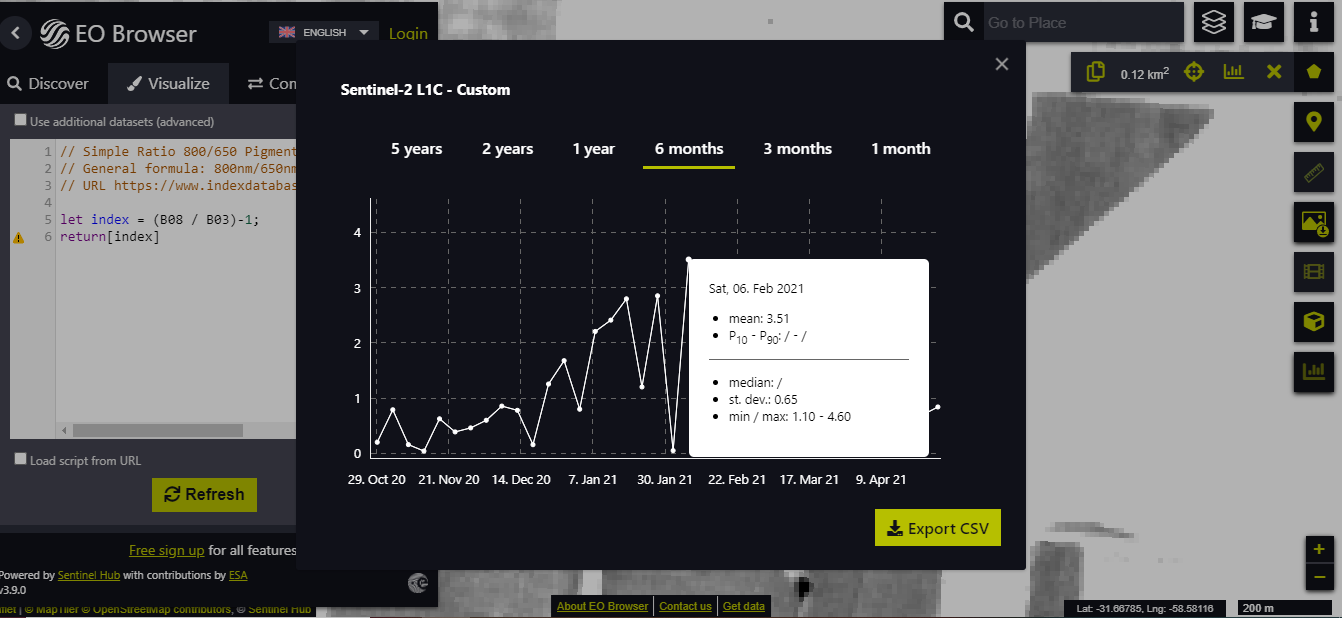
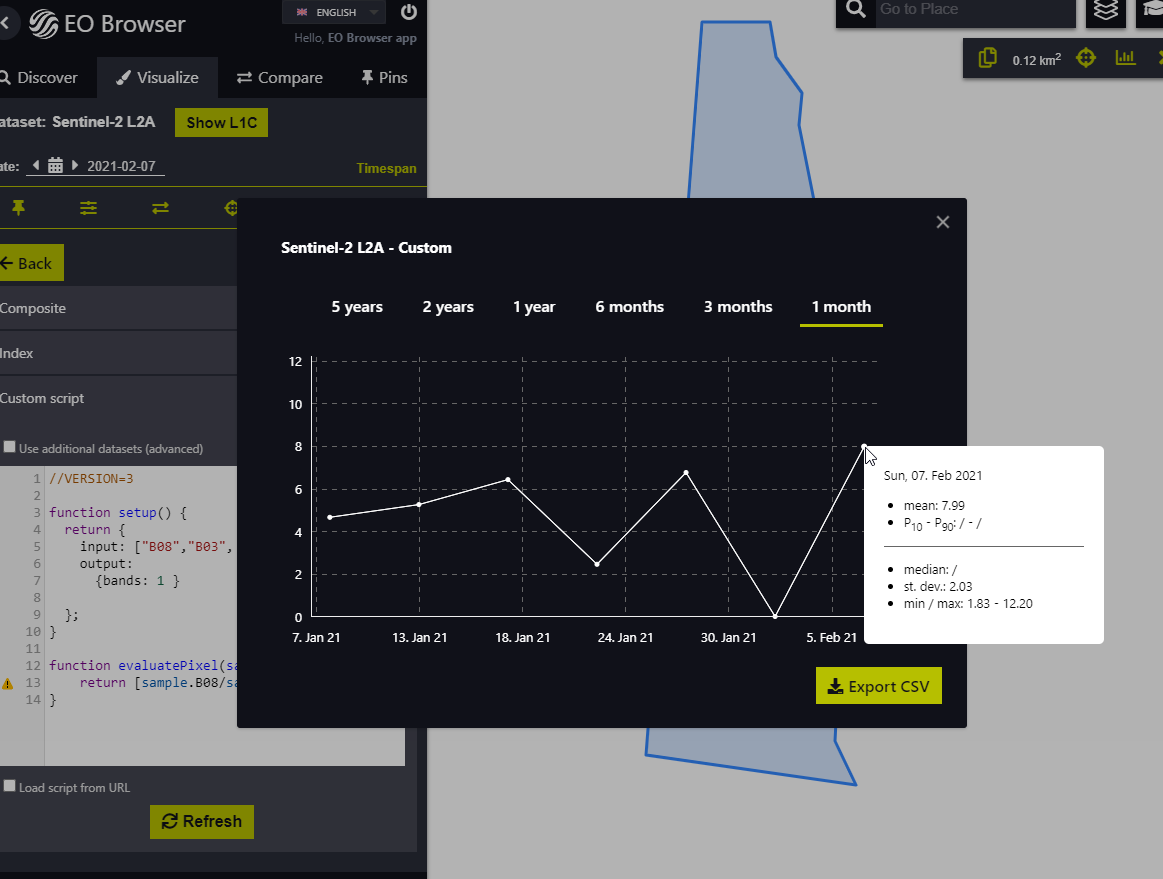
Hi, I´m trying to compute mean chlorophyll index derived from Sentinel 2 (“B8/B3-1”) for a polygon. When I try Statistical info from EO Browser (first image) I get that maximum (peak of the curve) mean value of the index for that polygon is 3.51 in 7th february.
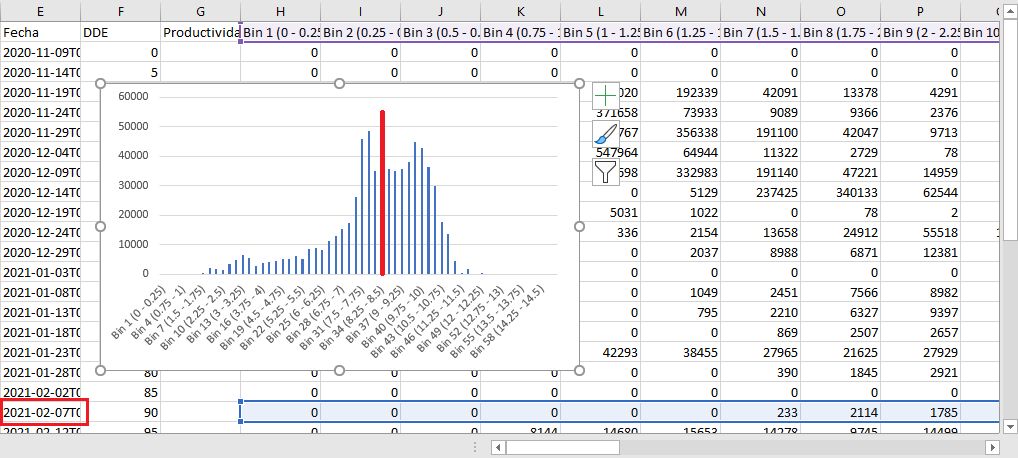
However, when I downloaded the histograms of the index for that polygon the mean value for that date is around 8.5 (second image).
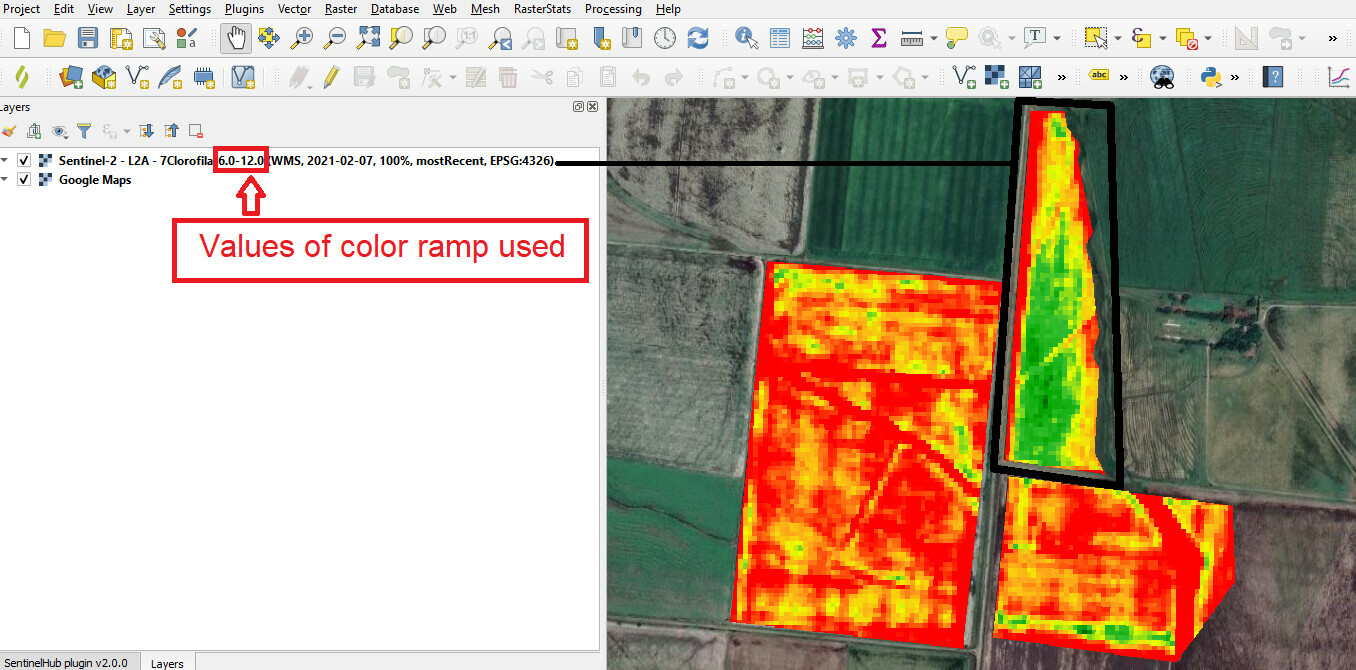
When using QGIS Sentinel Hub Plugin (third image), visualization shows that values are closer to a mean value of 8.5 than 3.51.
When I tried visualizations in other sources (like Google Earth Engine) values for that date are the same as Statistical API/QGIS Sentinel Hub Plugin.
I realised that this happens with all polygons that I tried. Why are those values (Statistical API/QGIS Sentinel Hub Plugin or GEE visualization) so different from values in EO Browser Statistical Info? And how can I get these higher values in the EO Browser Statistical info?


