Hi,


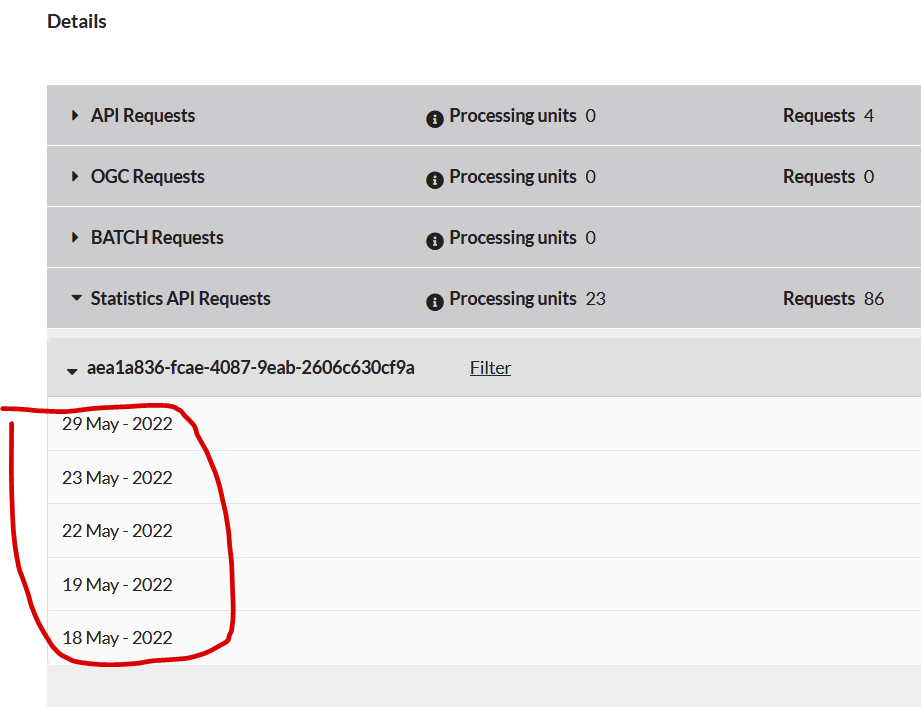
In the Dashboard Usage I can only see the dates on which requests were made (and the cumulative PU and RC):


But there is no information regarding what time each request was made and how much PU it consumed. So if I’m experiencing several different requests (e.g., float vs int, pixel size 10 vs 20, etc) I have no idea how much PU each took, I just get an accumulative number. I understand that the PU estimation when using POSTMAN is also not very accurate.


Is there a way to get this information? otherwise, it is impossible to track, analyze, and plan ahead for future requests.

Hi @org_accounts ,


Please try out our response headers which should provide the information you need.


Best Regards,

Chung


@chung.horng

There are 2 problems with the suggested solution:


  1. I’m obliged NOT to use Python


  2. If someone else sends a request, and I would like to know how many PU

    this request used (let’s say a day later), then it is not possible


Dear @org_accounts,

you can check response headers with any other tool as well, this is standard HTTP request.

It is unfortunately not feasible to store all individual requests for historic analysis, as we would bump in incompliance with privacy rules.

Best,

Grega


Reply