
Hi,


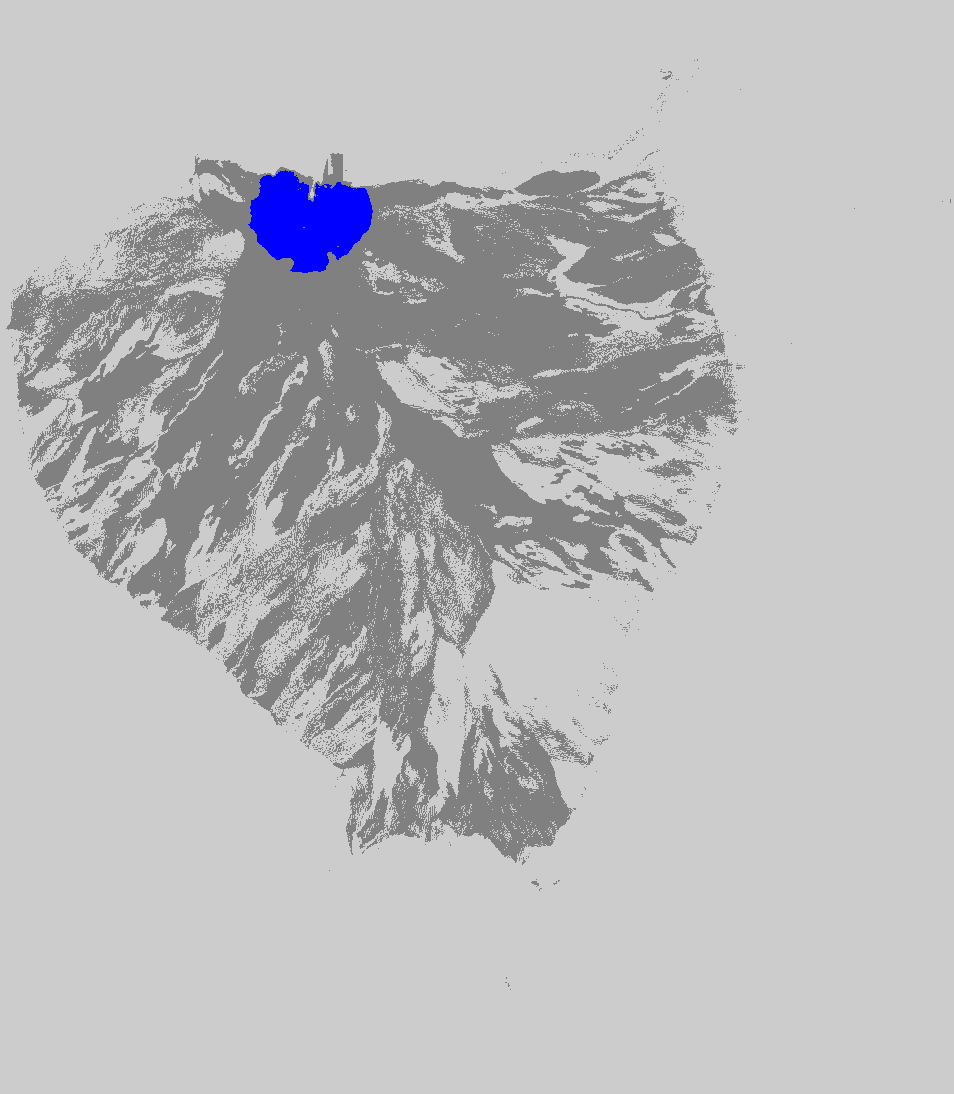
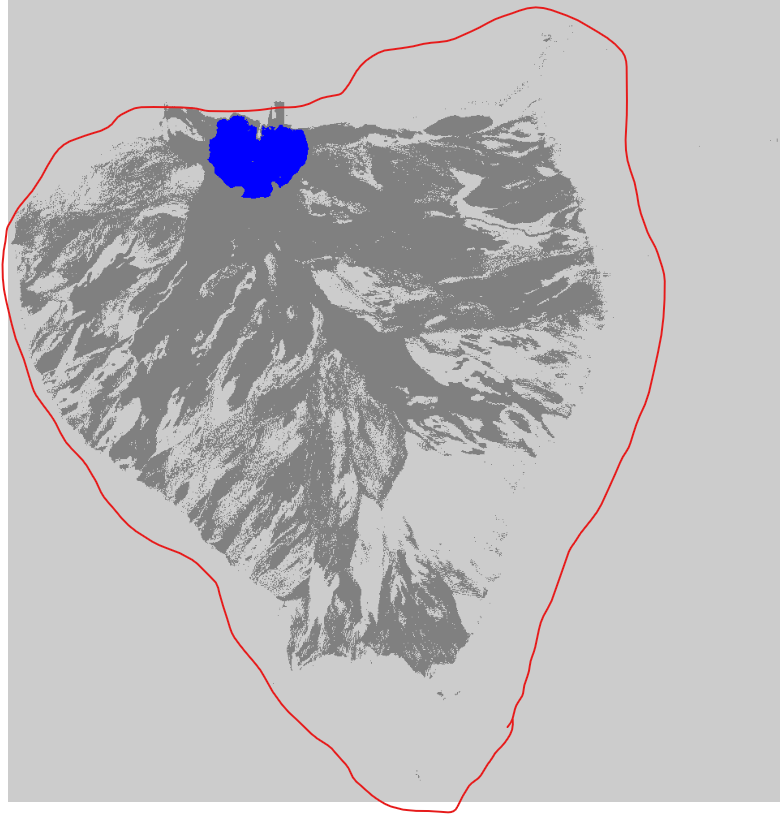
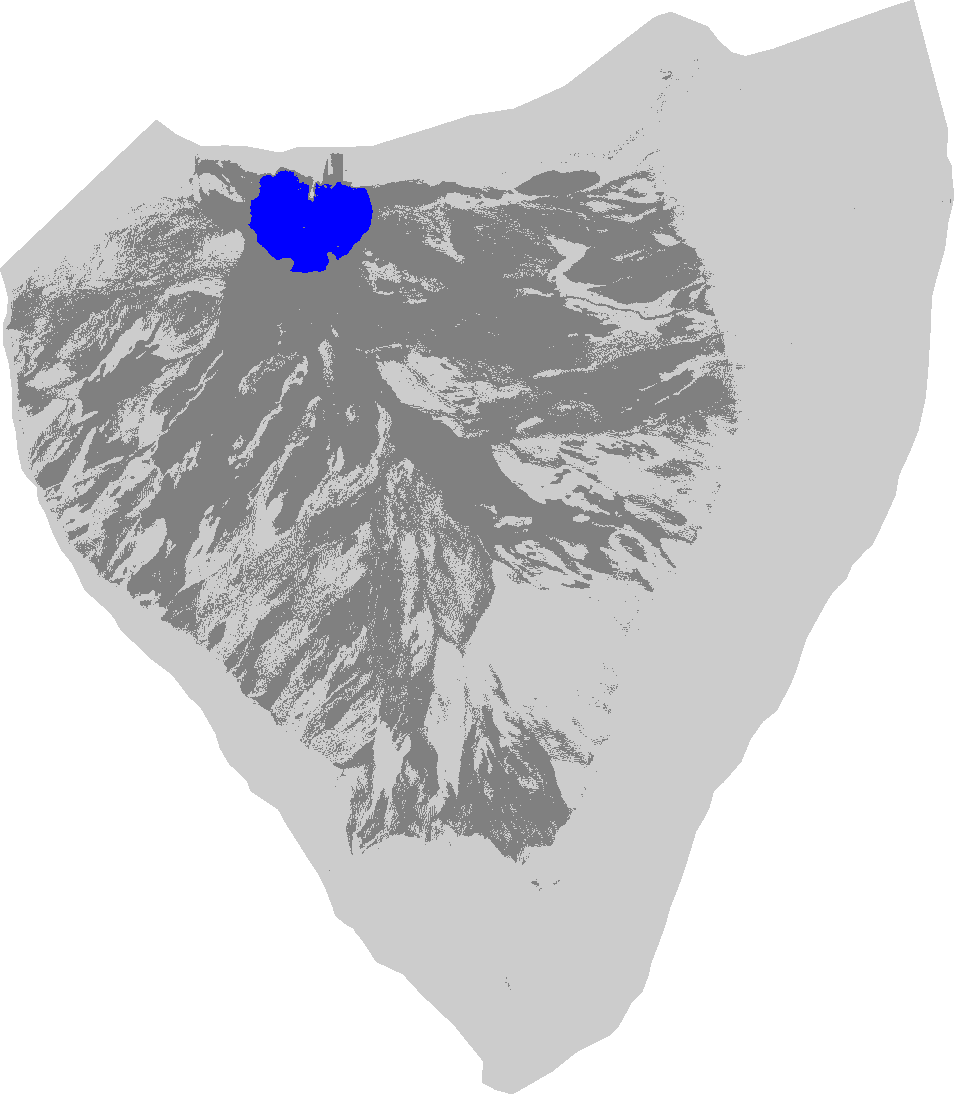
I’m using this endpoint https://services.sentinel-hub.com/api/v1/process to download an image. I am using a polygon and coordinates where the area of interest is correctly identified and an image is downloaded. However, the area outside the polygon is not blank and the image wont crop to that polygon. Attached is the output but the light grey goes beyond the polygon. How can this be cropped to show white outside the red line (polygon). The light grey inside the polygon is correct.


Hi,

You can take full control of the “no data” values outside of your polygon with the help of the dataMask in your evalscript. See the documentation here.

In the first example an if-statement is used to assign a value of your choice to all pixels outside of your polygon. If you just want to inspect the requested image and display the outside values in white, specify return u1, 1, 1] as follows:

function evaluatePixel(sample) {
if (sample.dataMask == 1) {
return u...]
} else {
return u1, 1, 1]
}

The second example makes use of a the dataMask as a fourth band, which acts as a transparency setting and works with png and tiff files. Are you specifying the output format in your request?
Make sure you add “dataMask” in your input statement and adjust the number of bands in the output section of your script.

If you were to use the image in a GIS program such as QGIS or ArcMap, you can simply set the “no data” value to the one you specified.

Best regards


Hi,

Thanks for the assistance. I was not aware of this feature so thank you for pointing it out. The issue i have is my evalscript is a range of equations so not sure how to combine this with the evaluatePixel code.

So where you have:

return [...]

This is where I need to add in my script? This is my code:

NDVImod = ((B08 - B03) / (B08 + B03))+1

wet = (B08 - B11) / (B08 + B11)
threshold_MI_1 = 0.2
threshold_MI_2 = 0.7
Fresh = (wet > threshold_MI_1) && (wet < threshold_MI_2)


if (NDVImod<0.2){
return [0, 0, 1];
}
if (NDVImod<1){
return [0.5, 0.5, 0.5];
}
if (Fresh){
return [0.5, 0.5, 0.5];
}
else{
return [0.8, 0.8, 0.8];
}

I am not sure how to combine the two.

I dont use a GIS program as i just need the tiff output of the direct SH payload.

Any guidance would be greatly appreciated.
Thanks


Hi,

Thank you for providing your script. Can you tell me how you are running your request? Just to avoid any misunderstandings.

 
:

So where you have:

return ...]

This is where I need to add in my script?

That is correct for the conditional visualization part of your script (if-statements). The definition of your modified NDVI belongs in front, but within the evaluate pixel function. Since the example function uses sample as an input parameter, you would need to add “sample.” to all your bands in the following way: (NOTE: you can change the name of the input parameter, but you need to be consistent in the use)

function evaluatePixel(sample) {
NDVImod = ((sample.B08 - sample.B03) / (sample.B08 + sample.B03))+1
wet = (sample.B08 ...

if (sample.dataMask == 1) {
if (NDVImod<0.2){
return t0, 0, 1];
}
if ...
} else {
return t1, 1, 1]
}
}

Then it should work. If not, we can take a look at the whole request and evalscript to figure it out.

Best regards


Hi,

Thanks for the informacion. I adjusted the script to the following:

function evaluatePixel(sample) {

NDVImod = ((B08 - B03) / (B08 + B03))+1

wet = (B08 - B11) / (B08 + B11)
threshold_MI_1 = 0.2
threshold_MI_2 = 0.7
Fresh = (wet > threshold_MI_1) && (wet < threshold_MI_2)

if (sample.dataMask == 1) {
if (NDVImod<0.4){
return [0, 0, 1];
}

if (NDVImod<1){
return [0.5, 0.5, 0.5];
}
if (Fresh){
return [0.5, 0.5, 0.5];
}

}
else{
return [0.8, 0.8, 0.8];
}

}

And received the following error.

b'{"error":{"status":400,"reason":"Bad Request","message":"Script failed to return.","code":"RENDERER_EXCEPTION"}}'

Should i PM you my full code and coordinates?


Hi,

I adjusted the evalscript for you:

//VERSION=3
function setup() {
return {
input: [{
bands:["B03", "B08", "B11", "dataMask"],
}],
output: {
id: "default",
bands: 3,
}
}
}


function evaluatePixel(sample) {
NDVImod = ((sample.B08 - sample.B03) / (sample.B08 + sample.B03))+1

wet = (sample.B08 - sample.B11) / (sample.B08 + sample.B11)
threshold_MI_1 = 0.2
threshold_MI_2 = 0.7
Fresh = (wet > threshold_MI_1) && (wet < threshold_MI_2)

if (sample.dataMask == 1) {
if (NDVImod<0.2){
return [0, 0, 1];
}
if (NDVImod<1){
return [0.5, 0.5, 0.5];
}
if (Fresh){
return [0.5, 0.5, 0.5];
}
else{
return [0.8, 0.8, 0.8];
}
} else {
return [1, 1, 1]
}
}

This evalscript should solve the issue. If you give this a try and still run into problems, I would like to take a look at your whole request in a PM to figure out the problem.

Best regards


Hi,

Thanks for the modified code. The script now works as intended and output shown below.

Just a comment, or if this is possible for a future modification. It would be good to change the “dataMask” area for a “True Color” option. This way you can have an anlaysis and place the current image outside the polygon area.

Thanks again for the help.


Hi,

Great that we could solve your problem! I hope my edits to the evalscript make sense to you. Feel free to ask if that is not the case, maybe even in a PM.
We are discussing your comment about the “True Color” option.

Best regards


Hi,

Thanks for the update. It might be also a good feature to have the True Color image within the polygon but with a transparency of the color overlays. So this way its possible to see the underlying image with the color sections over the top.

Let know if any of the two becomes an option as i would like to test this.
Cheers


Reply