Hello,

I have ordered PlanetScope images through Sentinel Hub and I’d like to use them to conduct land cover classification.
I have already conducted such a project using eo-learn library and Sentinel 2 imagery using the following command to collect S2 L2A imagery:

 add_data = SentinelHubInputTask(
bands_feature=(FeatureType.DATA, 'BANDS'),
bands = band_names,
resolution=10,
maxcc=0.8,
time_difference=timedelta(minutes=120),
data_collection=DataCollection.SENTINEL2_L2A,
additional_data=a(FeatureType.MASK, 'dataMask', 'IS_DATA'),
(FeatureType.MASK, 'CLM'),
(FeatureType.DATA, 'CLP')],
max_threads=5,
config=config
)

I tried to use similar command to create EOPatch from my Planet collection, replacing DataCollection.SENTINEL2_L2A with ‘byoc_collection’ (where byoc_collection = DataCollection.define_byoc(collection_id,is_timeless=False). However it did not work.
Should such a command work with a BYOC (or TDPI) collection ?
What is the best way to use TDPI collection in an EOPatch?
(I also tried using SentinelHubInputTask but I was only able to get one tiff file and could’nt use it as a proper EOTask to produce EOPatches).

Thanks,

Hi,

The following example shows how one can use BYOC data with SentinelHubInputTask and an equivalent task with SentinelHubEvalscriptTask. I hope they will provide enough details for you to tweak them to your use-case. The collection used is global cloudless mosaic @120 m

from sentinelhub import (
BBox, CRS,
DataCollection, MimeType,
bbox_to_dimensions
)

from eolearn.core import EOPatch, FeatureType, SaveTask
from eolearn.io import SentinelHubInputTask, SentinelHubEvalscriptTask

import matplotlib.pyplot as plt
import datetime as dt

caspian_sea_bbox = BBox([49.9604, 44.7176, 51.0481, 45.2324], crs=CRS.WGS84)
time_interval = '2020-03-10', '2020-05-01'

byoc = DataCollection.define_byoc('484d8dbb-9e3e-41f2-b96b-35189d3ae37f', service_url='https://services.sentinel-hub.com', is_timeless=False)

input_task = SentinelHubInputTask(
data_collection=byoc,
size=bbox_to_dimensions(caspian_sea_bbox, 200),
bands_feature=(FeatureType.DATA, 'bands'),
bands=['B01','B02','B03','B04','B05']
)

eop = input_task.execute(bbox=caspian_sea_bbox, time_interval=time_interval)

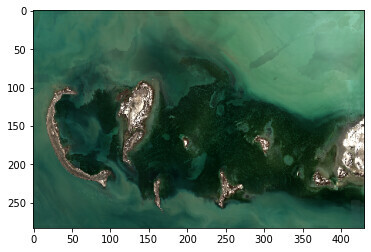
Plotting RGB image from eop gives me this:
image

The SentinelHubEvalscriptTask is very similar, but gives you the power to define evalscript yourself, with the added complexity that the evalscript outputs need to be named the same way as your eopatch features.

evalscript = """
function setup() {
return {
input: ["B02","B03","B04"],
output: [
{id: "RGB", bands: 3, sampleType: SampleType.FLOAT32},
],
}
}

function evaluatePixel(sample) {
return {
RGB: [sample.B04, sample.B03, sample.B02 ]
}
}
"""

evalscript_task = SentinelHubEvalscriptTask(
features=[(FeatureType.DATA, 'RGB')],
data_collection=byoc,
size=bbox_to_dimensions(caspian_sea_bbox, 200),
time_difference=dt.timedelta(hours=1),
evalscript=evalscript,
)

rgb_eop = evalscript_task.execute(bbox=caspian_sea_bbox, time_interval=time_interval)
plt.imshow(2.5*rgb_eop.data['RGB'][0]/10000.)

Plotting RGB from the rgb_eop produces same image as above:
image

Hope this helps!


Reply