I am very new to remote sensing. I got raw images from planet scope for my area of interest through QGIS plugi. however before I calculate NDVI for my area. I need to normalised or scale the bands. I am using this formula
def scale(band): # scale values for display purposes band = band.astype('float64') x1 = np.log10(float(np.percentile(band[band!=0], lower_percentile))) x2 = np.log10(float(np.percentile(band[band!=0], upper_percentile))) band[band==0]=np.nan band = np.log10(band) def equations(p): a, b = p return (np.log(a)-x1*b-np.log((1-y1)/y1), np.log(a)-x2*b-np.log((1-y2)/y2)) a,b = fsolve(equations, (1, 1)) band=1/(1+a*np.exp(-b*band)) return band.
Can somebody please tell why could be different method for scaling and is there any paper which can recommend for scaling the planet images?
Best answer by joe.kington
If you want to calculate NDVI, then you should not apply the type of normalization you’re referring to at all. You will get a very incorrect NDVI value that will depend on the specific spatial extent of the scene and not the actual land cover.
The “normalization” you’re applying is meant to be for quick visual display only. It’s a visualization method, not a data normalization method. In QGIS, you can apply visual stretches similar to what you’re doing on the fly and they do not need to be pre-calculated.
If you need the actual numerical values of the NDVI calculation to be meaningful, it’s critical to use reflectance as input. While it’s common to apply additional normalization to correct for scene to scene differences, that normalization should _never_ be based on the min/max content of each band as the formulas you’re using do. It’s critical to preserve band ratios for NDVI to be usable, and scaling based on the percentiles or min/max of each band will not preserve band ratios. It’s not even approximately correct to do so and it will always give wildly incorrect and unusable results for every satellite and every scene.
To calculate NDVI for surface reflectance data, you do not have to apply additional normalization and should use the (nir - red) / (nir + red) formula directly. You don’t even need to correct for the 0-10000 vs 0-1.0 integer representation scaling, because it’s applied to both bands. The output will be a floating point raster with a -1 to +1 overall range.
How you display that floating point data is up to you, but it’s important that the actual floating point values be correct and are able to be represented in the colorbar or other legend you make in your map.
If you want to adjust the display of the NDVI data, you should calculate NDVI then change the display parameters in the symbology tab in QGIS. A visualization that of a percentile stretch can be accomplished by setting the symbology to stretch to the requested percentile range (“cumulative count cut” under “min/max value settings” in the symbology tab for the raster) and then set a gamma stretch slider (which is a log stretch) in the “color rendering” section of the same tab. That will apply a similar visualization stretch to what you’re calculating when displaying the data automatically after you calculate NDVI. But it’s critical to not calculate NDVI with pre-stretched inputs.
Thank you for your reply. The resources that you have provided contain normalisation for top of atmosphere reflectance coefficient for each band. but I got data of surface reflectance with UDM for 4 bands from planet. I need to understand what should be method for normalising the band scales from surface reflectance data. I will be extremely grateful if you could help me on this.
Perviously I was using dynamic world method of using log normalisation but I have always seen used this method on sentinel or Landsat images, so I am not sure is this correct method for planet images?
If you want to calculate NDVI, then you should not apply the type of normalization you’re referring to at all. You will get a very incorrect NDVI value that will depend on the specific spatial extent of the scene and not the actual land cover.
The “normalization” you’re applying is meant to be for quick visual display only. It’s a visualization method, not a data normalization method. In QGIS, you can apply visual stretches similar to what you’re doing on the fly and they do not need to be pre-calculated.
If you need the actual numerical values of the NDVI calculation to be meaningful, it’s critical to use reflectance as input. While it’s common to apply additional normalization to correct for scene to scene differences, that normalization should _never_ be based on the min/max content of each band as the formulas you’re using do. It’s critical to preserve band ratios for NDVI to be usable, and scaling based on the percentiles or min/max of each band will not preserve band ratios. It’s not even approximately correct to do so and it will always give wildly incorrect and unusable results for every satellite and every scene.
To calculate NDVI for surface reflectance data, you do not have to apply additional normalization and should use the (nir - red) / (nir + red) formula directly. You don’t even need to correct for the 0-10000 vs 0-1.0 integer representation scaling, because it’s applied to both bands. The output will be a floating point raster with a -1 to +1 overall range.
How you display that floating point data is up to you, but it’s important that the actual floating point values be correct and are able to be represented in the colorbar or other legend you make in your map.
If you want to adjust the display of the NDVI data, you should calculate NDVI then change the display parameters in the symbology tab in QGIS. A visualization that of a percentile stretch can be accomplished by setting the symbology to stretch to the requested percentile range (“cumulative count cut” under “min/max value settings” in the symbology tab for the raster) and then set a gamma stretch slider (which is a log stretch) in the “color rendering” section of the same tab. That will apply a similar visualization stretch to what you’re calculating when displaying the data automatically after you calculate NDVI. But it’s critical to not calculate NDVI with pre-stretched inputs.
Thank you for your reply. I agree with you but can you recommend any data normalisation that preserves band relations just in case I want to better match with sentinel data. Interestingly all my images has positive NDVI values. is it possible also?
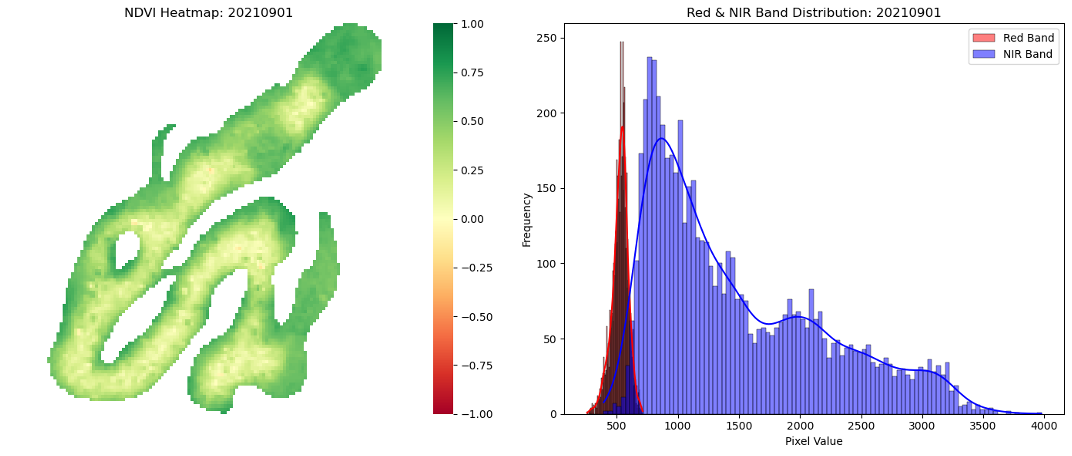
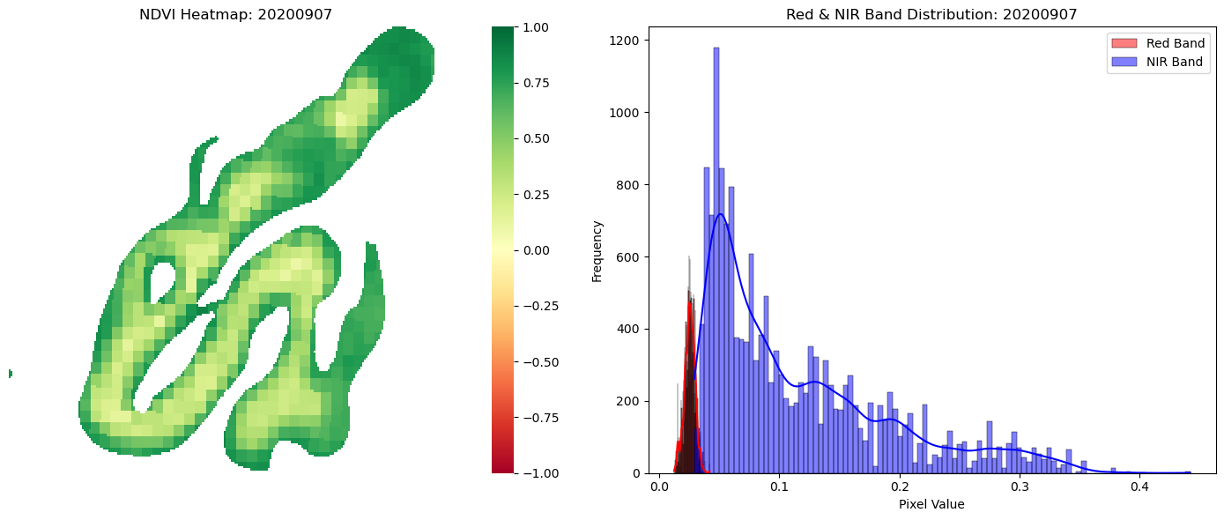
I have attached images from planet (Surface reflectance) and sentinel images (S2L2A, Bottom of the atmosphere (BOA) reflectance).
This one is planet image without any normalisation.
This is sentinel image (Sentinel 2 L2A). please I will be extremely grateful if you could help me in this.Green represent vegetation and yellow represent water according to images that we got from nearby images to understand.
Bare ground would be expected to have a low positive value (e.g. vaguely around 0.3). Water has a high variance in NDVI and can be positive or negative. NDVI is not meant to be used over water. Muddy water very often has a positive NDVI and is spectrally identical to bare soil in the wavelengths that Planetscope operates in. Negative NDVI is never a good way of classifying water, and water cannot be reliably classified based on spectral values alone without longer wavelength data (e.g. SWIR).
It sounds like you most likely want to apply no normalization at all.
If you do want normalization, try applying the “harmonize” operation during your request. (The harmonize operation reduces scene-to-scene variability in PS and tries to match FORCE-processed Sentinel2 SR data. Note that what you’re comparing to is most likely not FORCE-processed. FORCE is a specific SR correction (see Frantz, 2017) and what you’re working with is likely sen2cor or possibly LaSRC processed.)
Either way, positive NDVI values over water should be expected, especially if the water is muddy or shallow. Only clear deep water with no algae blooms or turbidity would be expected to have a negative NDVI.