I was wondering, if planet’s APIs provide an option to get aggregated statistical data of a long time series (~1 year) of PlanetScope daily imagery of a very small area (<1ha) or even just a point/pixel without having to “manually” download all applicable tiles and calculate the aggregated statistics locally.
Context: I want to extract average NDVI values of a small region for each day of a year and plot a time series of the NDVI development.
Any help is much appreciated!
Best answer by matt.ballard
In order to calculate NDVI values from PlanetScope imagery, you need to order the data. Ordering the data makes the full dataset available to you, whereas our preview images you see in places like Explorer are compressed tiles which don’t have the full spatial or spectral data.
Once you order the data, typically you would need to download the data to do you analysis, for example using Python or GIS tools.
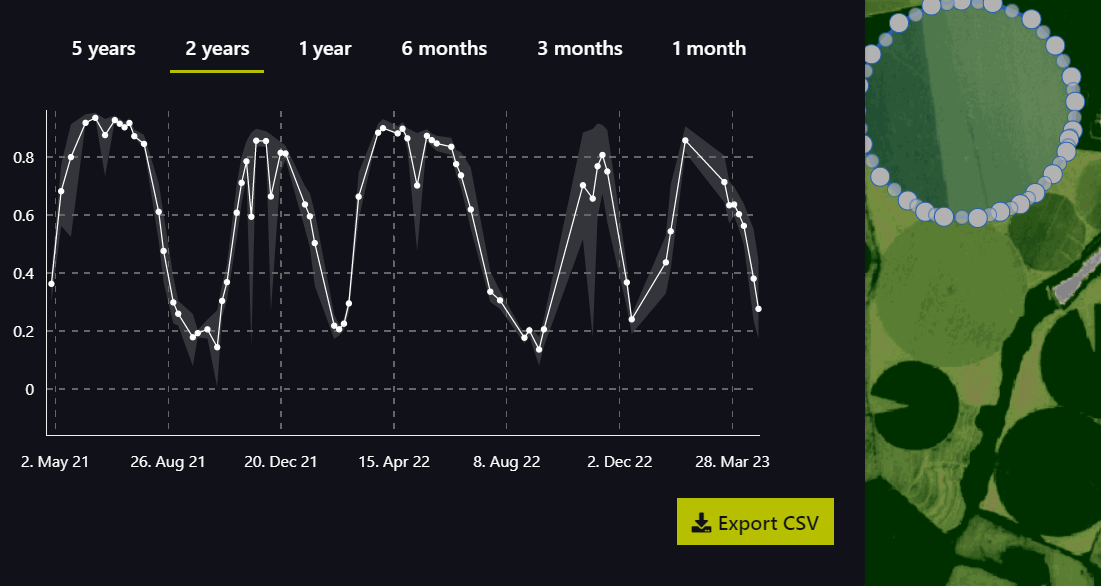
One option you have to not download the data is through Planet’s partner, Sinergise. They have built Sentinel Hub which has the ability to order data and deliver it to their cloud. Once the data is in Sentinel Hub, you can dynamically create NDVI time series graphs without ever downloading a raster. Here is a webinar on how to create a PlanetScope time series with Sentinel Hub and below is an example time series. This functionality requires paid license to Sentinel Hub which either Planet or Sinergise can help you get.
(note: Planet has entered into an agreement to acquire Sentinel Hub)
In order to calculate NDVI values from PlanetScope imagery, you need to order the data. Ordering the data makes the full dataset available to you, whereas our preview images you see in places like Explorer are compressed tiles which don’t have the full spatial or spectral data.
Once you order the data, typically you would need to download the data to do you analysis, for example using Python or GIS tools.
One option you have to not download the data is through Planet’s partner, Sinergise. They have built Sentinel Hub which has the ability to order data and deliver it to their cloud. Once the data is in Sentinel Hub, you can dynamically create NDVI time series graphs without ever downloading a raster. Here is a webinar on how to create a PlanetScope time series with Sentinel Hub and below is an example time series. This functionality requires paid license to Sentinel Hub which either Planet or Sinergise can help you get.
(note: Planet has entered into an agreement to acquire Sentinel Hub)