

For reforestation projects, it is vital to monitor the impact of environmental parameters on plant health and stress and to assist with the forest maintenance of the sites. To help monitor the sites, we built time series models for temperature, precipitation, and several vegetation indices to create a baseline for site-specific growing conditions.
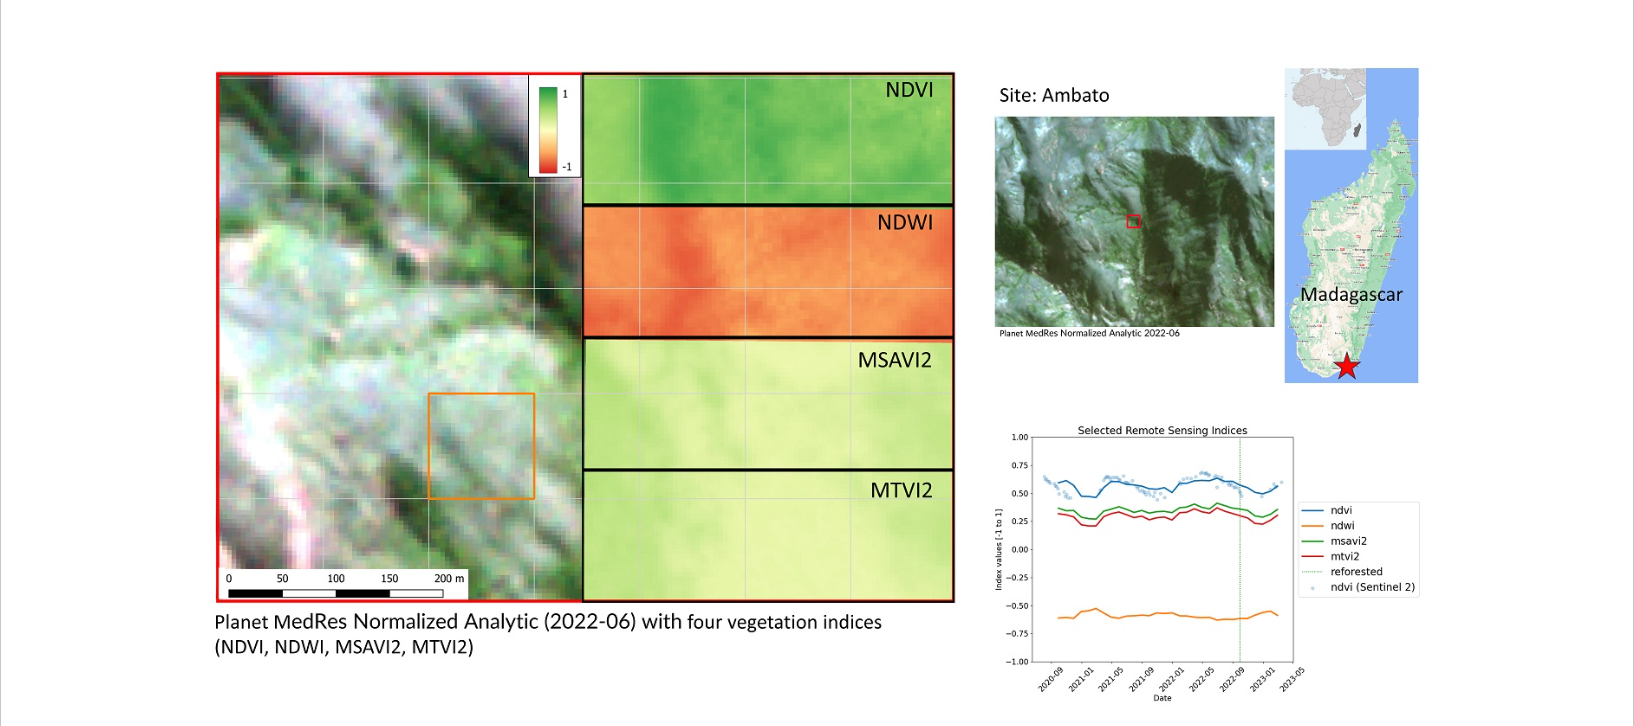
We compute the Normalized Difference Vegetation Index (NDVI) from the high-resolution image data provided by Planet (through the NICFI Basemaps for Tropical Forest Monitoring program) and use this as the primary indicator for site development. The spectral bands in the NICFI dataset allow us to calculate other indexes, as shown in the following image, and we use the Normalized Difference Water Index (NDWI) and Modified Soil Adjusted Vegetation Index (MSAVI2) to enforce the predictions.
The Modified Triangular Vegetation Index (MTVI2) could also be a good regressor in the prediction of NDVI in the reforested plot, but as the figure shows, the MTVI2 (in our site) is following the MSAVI2 too closely to have significant predictive power, and we decided not to use this index in the final model; currently, we are testing other indexes to complete the set (link).
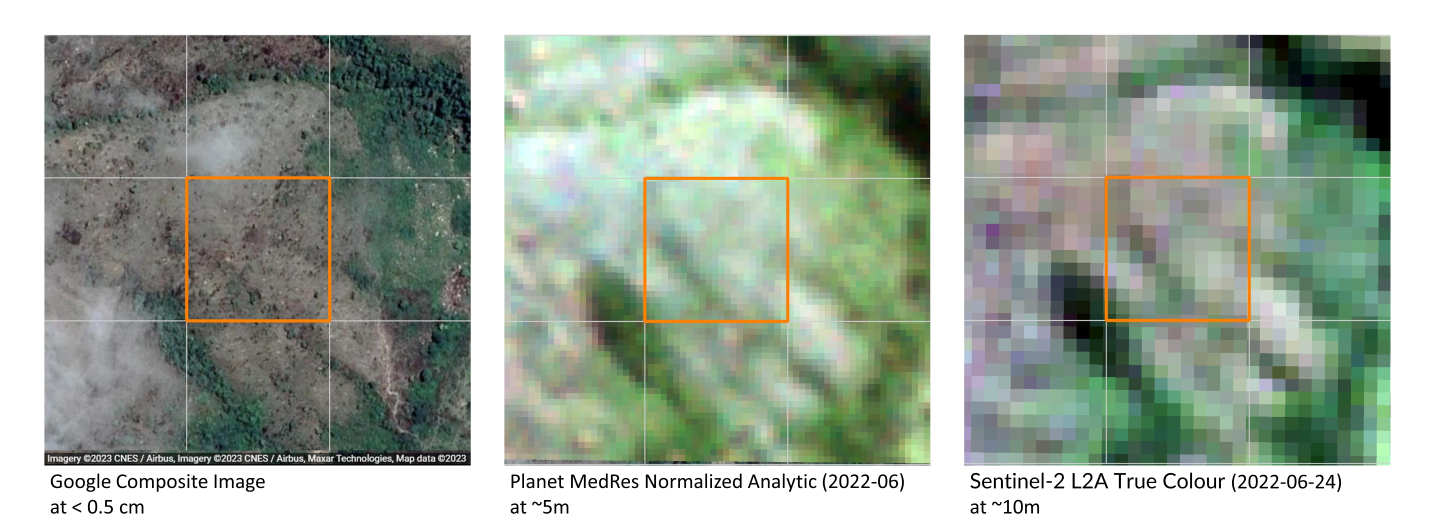
In the current configuration, as presented at the EGU 2023 (please find the poster here), we computed three vegetation indexes, from the satellite data, but only the NDVI is used as a tree health and stress predictor because this index has the strongest signal over the selected sites when fused with Copernicus Sentinel 2 data. In the images below, the middle image is an example of the NICFI data for a given day, and the terrain features are much more distinct than the image at the right (Sentinel 2) when compared to a very high-resolution image (Google).
Site conditions are constantly changing, and the mid-resolution monthly cloud-free data provides the monitoring capacity to timely verify the actual situation on the ground to the set baseline on historical data. Our test site is a sparsely vegetated area (NDVI between 0.45 and 0.65), which we can see in the left image, and in the NDVI Time Series graph, we see the fluctuation over time.
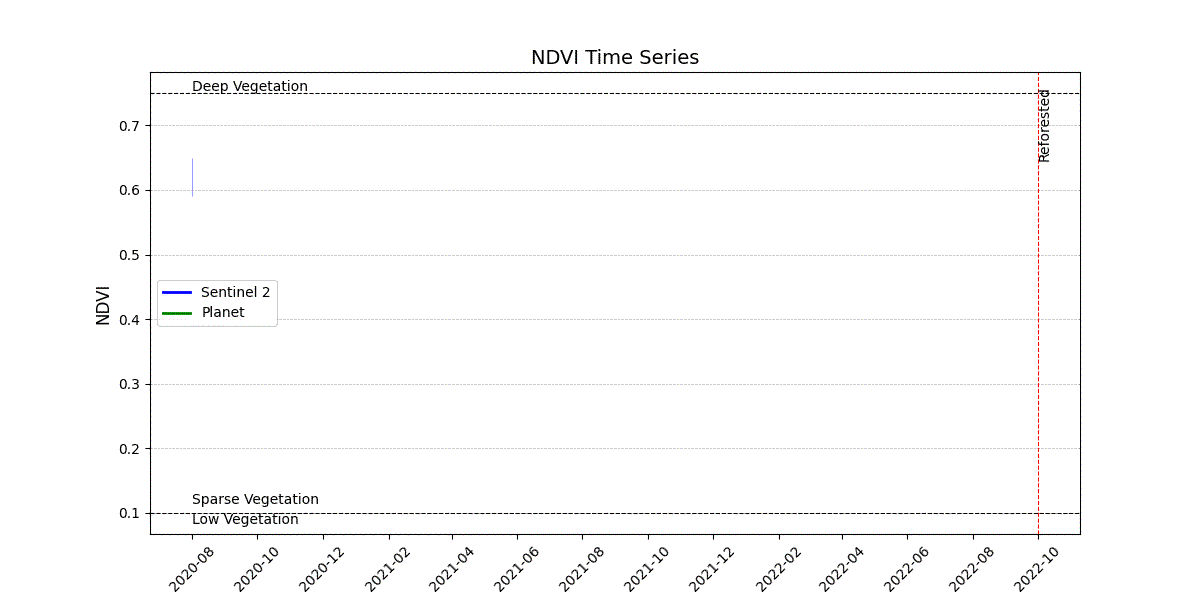
There are many remote sensing products available to calculate the NDVI (we have named two here already: Sentinel 2 and Planet), and each product has product-specific advantages and disadvantages; for the Sentinel 2 data is the higher spatial resolution (compared to MODIS and LandSat) and the more extended time series (compared to Planet), but the disadvantage of Sentinel data, compared to Planet and MODIS, is the revisiting time. In our example, the site didn’t receive full coverage (8 overpasses in a month), but the sentinels only collected twice a total of six useful images in a given month, and there were four months without any valid observation between 2020-07 and 2023-03 (32 months).
On average, the Sentinels collected, 4.5 useful images per month over the site, and this will still be significantly less compared to the daily observations obtained from the Planet constellation when cloud cover is removed. The NICFI data doesn’t give the daily reflectance, but because the daily data is used to compute the monthly average reflectance, not only is the data consistent over the period the average is also based on more samples, making the NDVI signal much more reliable than the NDVI values obtained from the sentinel dataset.
The presented workflow can help predict NDVI in different areas for a specified period in the future (three months window). It also demonstrates the usefulness of Facebook Prophet in forecasting and regression analysis using the derived indices from the Planet NICFI data.
H. Gijs J. Van den Dool(1) and Deepali Bidwai(2)
- Independent Researcher, France
- Independent Researcher, USA
