Solved

Comparing NDVI across PlanetScope images

  • June 26, 2025
  • 3 replies
  • 413 views

lucialayr
Forum|alt.badge.img+1

Hi everyone,


I recently worked with Planet data for the first time. I downloaded two PlanetScope images from the Planetary Explorer (RGB-IR reflectance and I also chose the option to harmonize images with Sentinel-2)

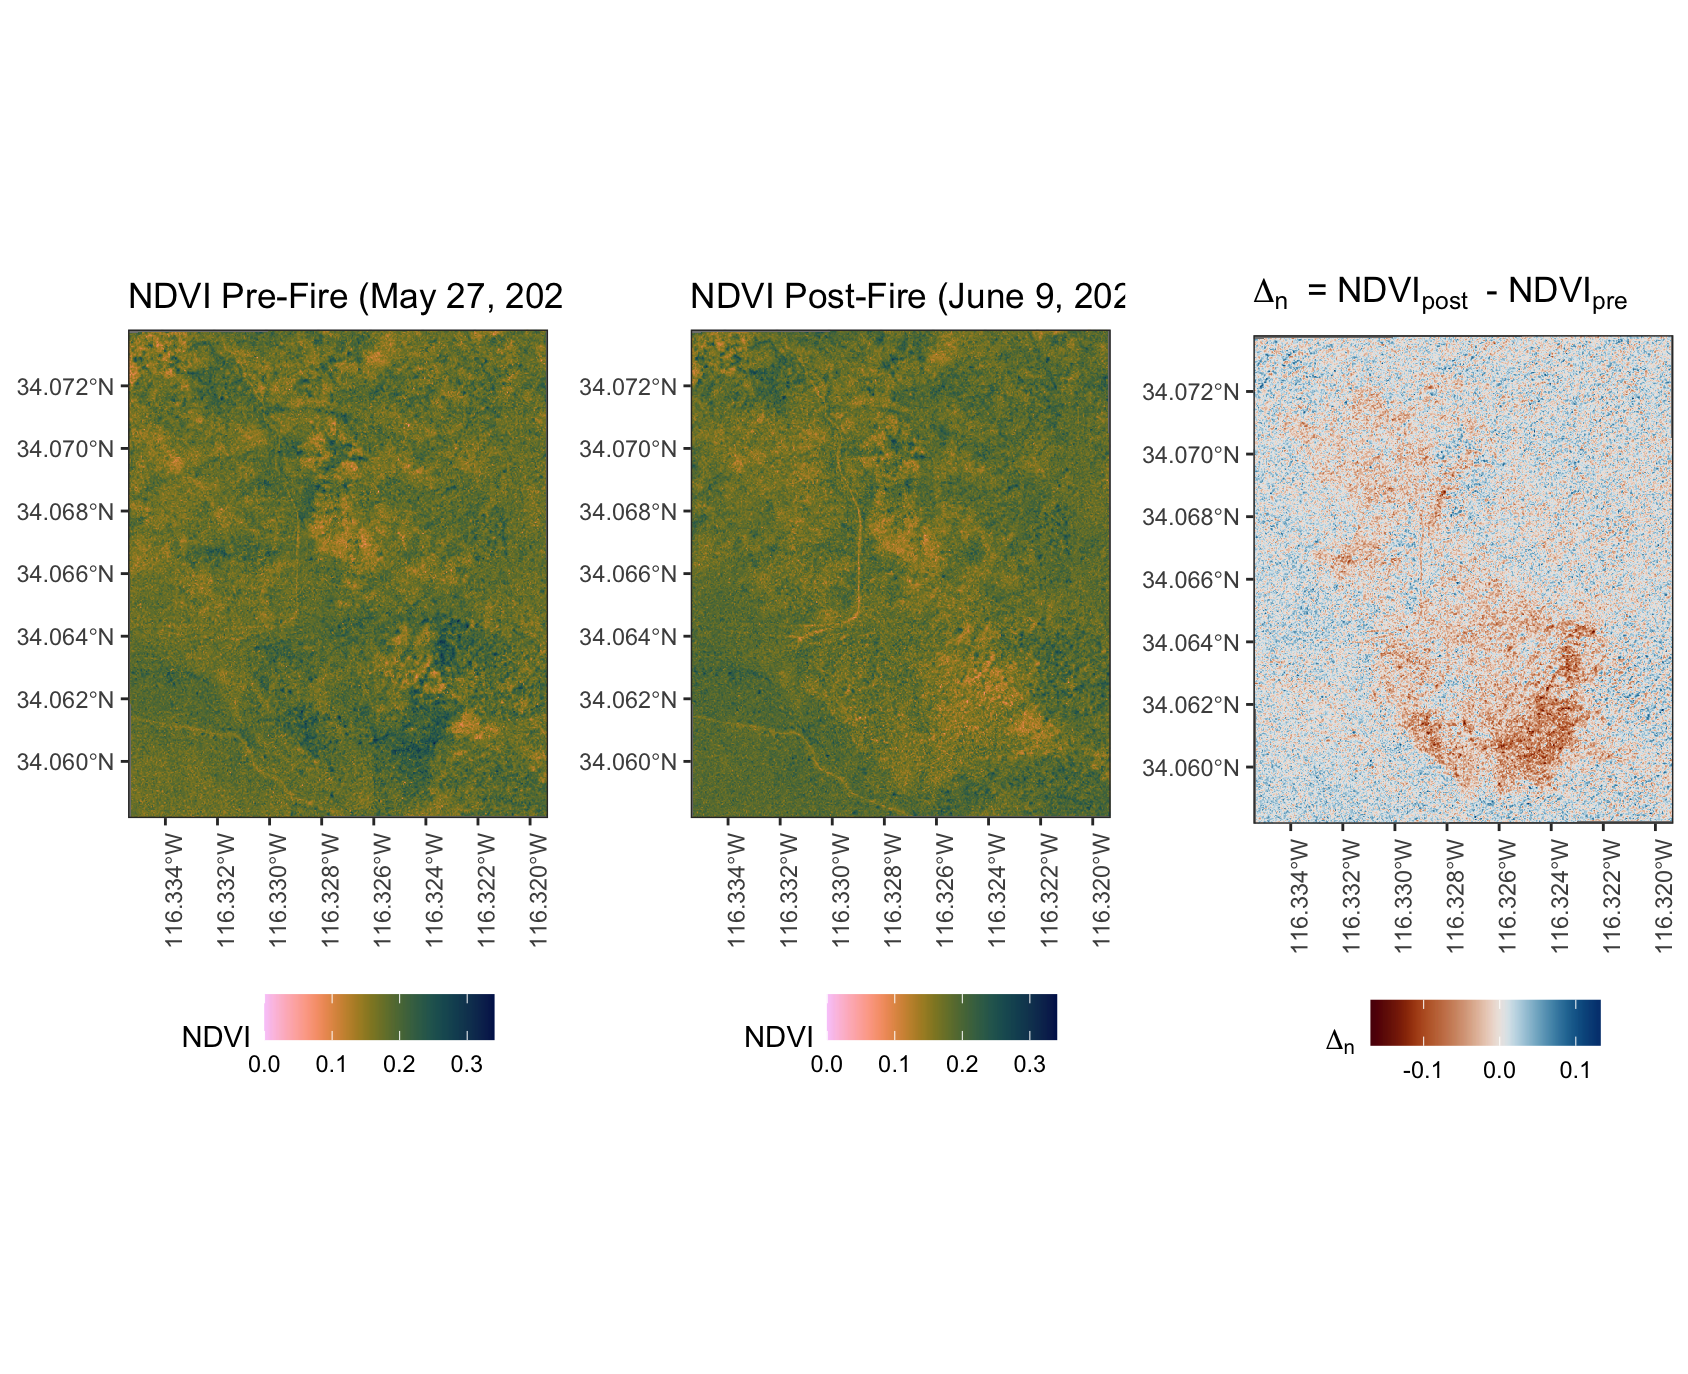
I then calculated NDVI for both images and then the average. I am very surprised by the averages I find. In the center of the image a fire happened in between the two dates so I would expect NDVI to decrease (makes sense). However, I am suspicions of the increases in NDVI I see in other areas, that seem to be the same order of magnitude. While this could be an artifact of NDVI just being quite low in general, I was still wondering if there is an issue with comparing data across difference images taken by different satellites?

Here is the code I used to process the data (in R):

library(tidyverse)
library(sf)
library(terra)
library(tidyterra)

NDVI = function(raster) {
ndvi_r = (raster[[4]] - raster[[3]]) / (raster[[4]] + raster[[3]])

return(ndvi_r)
}

raster_prefire = terra::rast('2025-05-27_strip_8094341_composite_file_format.tif')
raster_postfire = terra::rast('2025-06-09_strip_8121430_composite_file_format.tif')

NDVI_prefire = NDVI(raster_prefire)
NDVI_postfire = NDVI(raster_postfire)

NDndvi = (NDVI_postfire - NDVI_prefire)

Best answer by elyhienrich

There's no issue with comparing NDVI across multiple images because NDVI is a standardized calculation.

However NDVI ranges from -1 to 1 (vegetation values from 0 to 1). Dense vegetation usually has values 0.6 and higher. The NDVI values shown here are all under 0.3 and the change detection image has an even smaller range. Something may be wrong with the NDVI images, the calculation looks correct- what imagery did you download? How many bands?

3 replies

elyhienrich
Community Manager 🌎
Forum|alt.badge.img+17
  • Community Manager 🌎
  • Answer
  • July 1, 2025

There's no issue with comparing NDVI across multiple images because NDVI is a standardized calculation.

However NDVI ranges from -1 to 1 (vegetation values from 0 to 1). Dense vegetation usually has values 0.6 and higher. The NDVI values shown here are all under 0.3 and the change detection image has an even smaller range. Something may be wrong with the NDVI images, the calculation looks correct- what imagery did you download? How many bands?


lucialayr
Forum|alt.badge.img+1
  • Author
  • ‎‎ 🌱
  • July 7, 2025

Hi Ely,


thank you for your reply! I used four-band images (RGB-IR reflectance, harmonized with Sentinel-2) 

I’m not too worried about the range of NDVI. This is in the desert, and there is not a lot of vegetation. The values looks comparable to what I am used to from working with Landsat. I might have to check daily variability in NDVI and use multiple images to calculate the pre- and post-state, though I find it hard to believe that natural variability would be that high. 


matt.ballard
Planeteer 🌎
Forum|alt.badge.img+5
  • Planeteer 🌎
  • July 7, 2025

The speckled pattern of blue around the scene could be caused by a few things such as from scene-to-scene variability, radiometric noise, atmospheric differences between collections. As well, at lower values of NDVI, small changes is reflectance can cause larger shifts in NDVI value changes.

Things you can do to improve this analysis output could be to:

  • You may want to add a larger transparent region of the color map around -0.05 → 0.05 where those values are so small they represent areas that most likely didn’t see real change. Or only display in your color ramp the areas with a decrease in NDVI
  • You could resample at a lower pixel size, essentially aggregating multiple pixels would increase the signal your are seeing. Or use a low pass filter to reduce some of the noise.
  • You could add additional observations before and after the fire - for example to calculate a median from 3 days before the fire to use as a baseline. The median value is going to be closer to the true value and account for some of the variability.
  • You might explore using different indices like SAVI which might be more well-adjusted to arid zones