Hi,
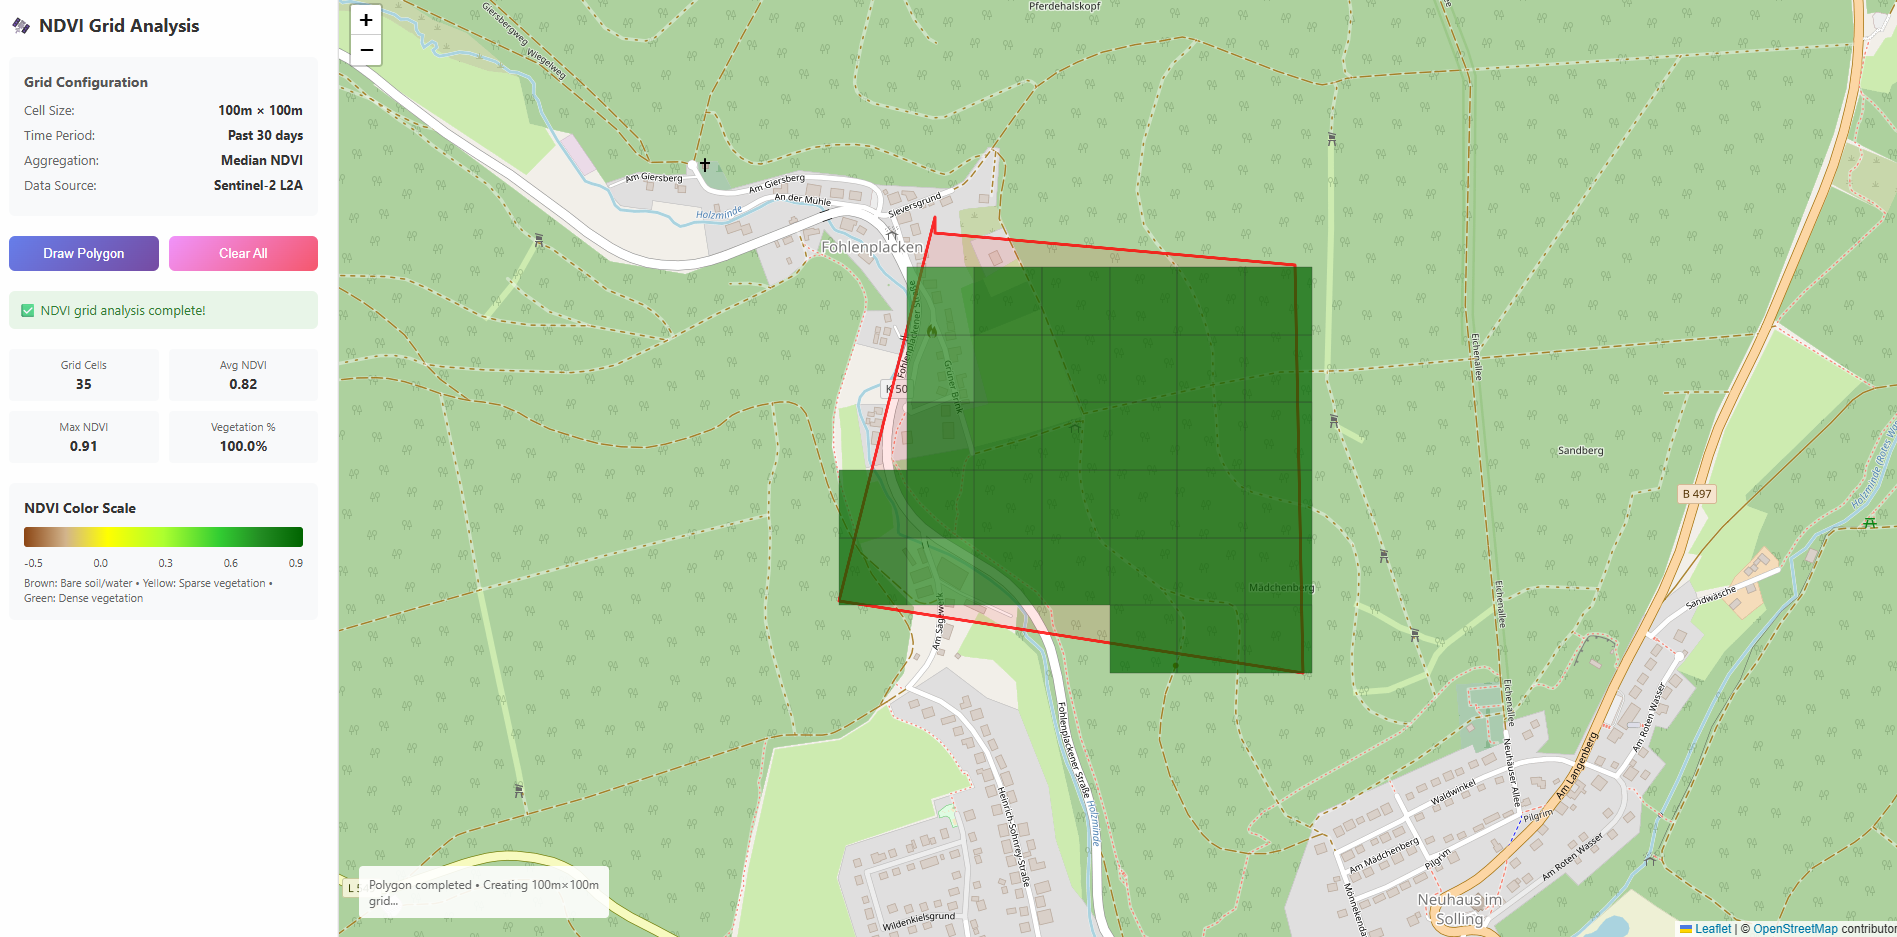
We are trying to display all NDVI data on a map (as polygons). Is it possible to show NDVI values in a 10×10 px grid within the polygon using a single API call?
My sample code : But it is giving the image So it is not correct code for NDVI value with polygon
<!DOCTYPE html>
<html lang="en">
<head>
<meta charset="UTF-8">
<meta name="viewport" content="width=device-width, initial-scale=1.0">
<title>Dynamic NDVI Map with Polygon Drawing</title>
<script src="https://api.mapbox.com/mapbox-gl-js/v2.3.1/mapbox-gl.js"></script>
<link href="https://api.mapbox.com/mapbox-gl-js/v2.3.1/mapbox-gl.css" rel="stylesheet" />
<script src="https://cdn.jsdelivr.net/npm/chart.js"></script>
<style>
body {
margin: 0;
padding: 0;
font-family: Arial, sans-serif;
}
#map {
position: absolute;
top: 0;
bottom: 0;
width: 100%;
}
.map-overlay {
position: absolute;
background: rgba(255, 255, 255, 0.8);
padding: 10px;
border-radius: 5px;
}
#info {
bottom: 20px;
left: 20px;
}
#controls {
top: 20px;
left: 20px;
}
#ndvi-chart-container {
bottom: 20px;
right: 20px;
width: 300px;
height: 200px;
padding: 10px;
}
button {
background-color: #4CAF50;
border: none;
color: white;
padding: 8px 16px;
text-align: center;
text-decoration: none;
display: inline-block;
font-size: 14px;
margin: 4px 2px;
cursor: pointer;
border-radius: 4px;
}
button:disabled {
background-color: #cccccc;
cursor: not-allowed;
}
#ndvi-chart {
width: 100%;
height: 100%;
}
.close-polygon-btn {
position: absolute;
top: 60px;
left: 20px;
background-color: #f44336;
display: none;
}
</style>
</head>
<body>
<div id="map"></div>
<div class="map-overlay" id="controls">
<button id="draw-polygon">Draw Polygon</button>
<button id="clear-polygon" disabled>Clear Polygon</button>
<button id="close-polygon" class="close-polygon-btn">Close Polygon</button>
</div>
<div class="map-overlay" id="info">
<div>Draw a polygon to see NDVI values</div>
</div>
<div class="map-overlay" id="ndvi-chart-container">
<canvas id="ndvi-chart"></canvas>
</div>
<script>
// Initialize Mapbox map
mapboxgl.accessToken = 'TOKEN';
const map = new mapboxgl.Map({
container: 'map',
style: 'mapbox://styles/mapbox/satellite-v9',
center: [9.511, 51.768], // Default coordinates
zoom: 13
});
// Variables for drawing control
let draw = null;
let currentPolygon = null;
let ndviChart = null;
let polygonCoords = [];
let clickHandler = null;
let markers = [];
// DOM elements
const drawButton = document.getElementById('draw-polygon');
const clearButton = document.getElementById('clear-polygon');
const closeButton = document.getElementById('close-polygon');
const infoDiv = document.getElementById('info');
const chartCanvas = document.getElementById('ndvi-chart');
// Initialize chart
function initChart() {
if (ndviChart) {
ndviChart.destroy();
}
ndviChart = new Chart(chartCanvas, {
type: 'line',
data: {
labels: [],
datasets: [{
label: 'NDVI Values',
data: [],
borderColor: 'rgb(75, 192, 192)',
tension: 0.1,
fill: false
}]
},
options: {
responsive: true,
maintainAspectRatio: false,
scales: {
y: {
min: -1,
max: 1
}
}
}
});
}
// Update chart with NDVI data
function updateChart(ndviData) {
if (!ndviChart) initChart();
// For demo purposes, we'll generate some sample data
// In a real app, you would use actual time-series NDVI data
const dates = [];
const values = [];
// Generate 10 days of sample data
for (let i = 0; i < 10; i++) {
const date = new Date();
date.setDate(date.getDate() - (9 - i));
dates.push(date.toLocaleDateString());
// Generate random NDVI values between 0.2 and 0.8
values.push((Math.random() * 0.6 + 0.2).toFixed(2));
}
ndviChart.data.labels = dates;
ndviChart.data.datasets[0].data = values;
ndviChart.update();
}
// Function to clear all layers and sources
function clearMap() {
// Remove NDVI raster layer if it exists
if (map.getLayer('ndvi-raster-layer')) {
map.removeLayer('ndvi-raster-layer');
}
// Remove NDVI raster source if it exists
if (map.getSource('ndvi-raster')) {
map.removeSource('ndvi-raster');
}
// Remove polygon layers if they exist
if (map.getLayer('polygon-layer')) {
map.removeLayer('polygon-layer');
}
if (map.getLayer('polygon-fill')) {
map.removeLayer('polygon-fill');
}
// Remove polygon source if it exists
if (map.getSource('polygon')) {
map.removeSource('polygon');
}
// Remove temporary drawing layers
if (map.getLayer('temp-line-layer')) {
map.removeLayer('temp-line-layer');
}
if (map.getSource('temp-line')) {
map.removeSource('temp-line');
}
// Remove all markers
markers.forEach(marker => marker.remove());
markers = [];
// Reset current polygon
currentPolygon = null;
polygonCoords = [];
// Disable clear button and hide close button
clearButton.disabled = true;
closeButton.style.display = 'none';
drawButton.disabled = false;
// Reset info div
infoDiv.innerHTML = '<div>Draw a polygon to see NDVI values</div>';
// Clear chart data
if (ndviChart) {
ndviChart.data.labels = [];
ndviChart.data.datasets[0].data = [];
ndviChart.update();
}
}
// Function to add a polygon to the map
function addPolygon(coordinates) {
// Clear any existing layers first
clearMap();
// Store current polygon
currentPolygon = coordinates;
// Add the polygon as a layer
map.addSource('polygon', {
'type': 'geojson',
'data': {
'type': 'Feature',
'geometry': {
'type': 'Polygon',
'coordinates': [coordinates]
}
}
});
// Add outline layer
map.addLayer({
'id': 'polygon-layer',
'type': 'line',
'source': 'polygon',
'layout': {},
'paint': {
'line-color': '#ff0000',
'line-width': 2
}
});
// Add fill layer
map.addLayer({
'id': 'polygon-fill',
'type': 'fill',
'source': 'polygon',
'paint': {
'fill-color': '#ff0000',
'fill-opacity': 0.1
}
});
// Enable clear button
clearButton.disabled = false;
// Fetch NDVI data for this polygon
fetchNDVIData(coordinates);
}
// Function to complete the polygon
function completePolygon() {
if (polygonCoords.length >= 3) {
// Close the polygon by adding the first point again
polygonCoords.push([...polygonCoords[0]]);
// Remove temporary line
if (map.getLayer('temp-line-layer')) {
map.removeLayer('temp-line-layer');
}
if (map.getSource('temp-line')) {
map.removeSource('temp-line');
}
// Remove click handler
if (clickHandler) {
map.off('click', clickHandler);
clickHandler = null;
}
// Hide close button
closeButton.style.display = 'none';
// Add the completed polygon
addPolygon(polygonCoords);
drawButton.disabled = false;
} else {
infoDiv.innerHTML = '<div style="color: red;">Need at least 3 points to create a polygon</div>';
}
}
// Function to fetch NDVI data from Sentinel Hub
async function fetchNDVIData(polygonCoords) {
try {
infoDiv.innerHTML = '<div>Fetching NDVI data...</div>';
// Convert polygon coordinates to WKT format
const wktCoords = polygonCoords.map(coord => `${coord[0]} ${coord[1]}`).join(', ');
const geometry = `POLYGON((${wktCoords}))`;
// Get bounding box for the polygon with a small buffer
const bbox = getBbox([polygonCoords]);
const [minLng, minLat, maxLng, maxLat] = bbox.split(',').map(Number);
// Get current date and date from 10 days ago for time range
const toDate = new Date().toISOString().split('T')[0];
const fromDate = new Date(Date.now() - 10 * 24 * 60 * 60 * 1000).toISOString().split('T')[0];
// Construct the WMS request URL
const params = new URLSearchParams({
service: 'WMS',
request: 'GetMap',
version: '1.3.0',
layers: 'CUSTOM-NDVI',
bbox: bbox,
width: '1024',
height: '1024',
crs: 'EPSG:4326',
format: 'image/png',
transparent: true,
time: `${fromDate}/${toDate}`,
maxcc: 20, // Maximum cloud coverage percentage
geometry: geometry,
styles: 'ndvi,default'
});
const url = `https://services.sentinel-hub.com/ogc/wms/b3109d7d-af97-4142-82d0-43241a83bb5c?${params.toString()}`;
console.log("Request URL:", url); // For debugging
const response = await fetch(url, {
headers: {
'Authorization': 'Bearer SHUB-TOKEN'
}
});
if (!response.ok) {
throw new Error(`HTTP error! status: ${response.status}`);
}
// Get the image as a blob
const blob = await response.blob();
const imageUrl = URL.createObjectURL(blob);
// Add the NDVI image as a raster layer with precise coordinates
map.addSource('ndvi-raster', {
'type': 'image',
'url': imageUrl,
'coordinates': [
[minLng, maxLat], // top-left
[maxLng, maxLat], // top-right
[maxLng, minLat], // bottom-right
[minLng, minLat] // bottom-left
]
});
// Add the NDVI layer with a clip to the polygon
map.addLayer({
id: 'ndvi-raster-layer',
'type': 'raster',
'source': 'ndvi-raster',
'paint': {
'raster-opacity': 0.7
},
'layout': {
'visibility': 'visible'
},
'source-layer': 'polygon' // Clip to the polygon source
}, 'polygon-fill'); // Place below the polygon fill for visibility
// Update info div
infoDiv.innerHTML = `
<div><strong>Polygon Area:</strong> NDVI data loaded</div>
<div>Click on the map to see details</div>
`;
// Update chart with sample data
updateChart();
// Add click event to show NDVI values
map.on('click', 'ndvi-raster-layer', function(e) {
infoDiv.innerHTML = `
<div><strong>Location:</strong> ${e.lngLat.lng.toFixed(4)}, ${e.lngLat.lat.toFixed(4)}</div>
<div><strong>NDVI:</strong> ${(Math.random() * 0.6 + 0.2).toFixed(2)} (sample data)</div>
`;
});
// Change the cursor to a pointer when hovering over the NDVI layer
map.on('mouseenter', 'ndvi-raster-layer', function() {
map.getCanvas().style.cursor = 'pointer';
});
map.on('mouseleave', 'ndvi-raster-layer', function() {
map.getCanvas().style.cursor = '';
});
} catch (error) {
console.error('Error fetching NDVI data:', error);
infoDiv.innerHTML = `
<div style="color: red;">Error fetching NDVI data</div>
<div>${error.message}</div>
`;
}
}
// Function to calculate bounding box from polygon coordinates with buffer
function getBbox(polygonCoords) {
const lngs = polygonCoords[0].map(coord => coord[0]);
const lats = polygonCoords[0].map(coord => coord[1]);
const minLng = Math.min(...lngs);
const maxLng = Math.max(...lngs);
const minLat = Math.min(...lats);
const maxLat = Math.max(...lats);
// Add a small buffer (e.g., 10% of the range) to ensure the image covers the polygon
const lngBuffer = (maxLng - minLng) * 0.1;
const latBuffer = (maxLat - minLat) * 0.1;
return [
minLng - lngBuffer,
minLat - latBuffer,
maxLng + lngBuffer,
maxLat + latBuffer
].join(',');
}
// Helper function to add point markers
function addPointMarker(coords, index) {
const marker = document.createElement('div');
marker.className = 'point-marker';
marker.style.width = '12px';
marker.style.height = '12px';
marker.style.backgroundColor = '#ff0000';
marker.style.borderRadius = '50%';
marker.style.border = '2px solid white';
marker.style.cursor = 'pointer';
marker.title = `Point ${index + 1}`;
const markerObj = new mapboxgl.Marker(marker)
.setLngLat(coords)
.addTo(map);
markers.push(markerObj);
return markerObj;
}
// Initialize drawing controls
function initDrawingControls() {
// Set up draw button
drawButton.addEventListener('click', function() {
if (polygonCoords.length > 0) return;
drawButton.disabled = true;
infoDiv.innerHTML = '<div>Click on the map to start drawing a polygon</div>';
// Start drawing mode
map.once('click', function(e) {
const startPoint = [e.lngLat.lng, e.lngLat.lat];
polygonCoords = [startPoint];
// Show close button
closeButton.style.display = 'block';
// Create a temporary line feature
map.addSource('temp-line', {
'type': 'geojson',
'data': {
'type': 'Feature',
'geometry': {
'type': 'LineString',
'coordinates': polygonCoords
}
}
});
map.addLayer({
'id': 'temp-line-layer',
'type': 'line',
'source': 'temp-line',
'layout': {},
'paint': {
'line-color': '#ff0000',
'line-width': 2
}
});
// Add first point marker
addPointMarker(startPoint, 0);
// Handle subsequent clicks
clickHandler = function(e) {
const newPoint = [e.lngLat.lng, e.lngLat.lat];
polygonCoords.push(newPoint);
// Update the line
map.getSource('temp-line').setData({
'type': 'Feature',
'geometry': {
'type': 'LineString',
'coordinates': polygonCoords
}
});
// Add new point marker
addPointMarker(newPoint, polygonCoords.length - 1);
};
map.on('click', clickHandler);
});
});
// Set up close button
closeButton.addEventListener('click', completePolygon);
// Set up clear button
clearButton.addEventListener('click', clearMap);
}
// Initialize the map and controls when it loads
map.on('load', function() {
initDrawingControls();
initChart();
});
</script>
</body>
</html>