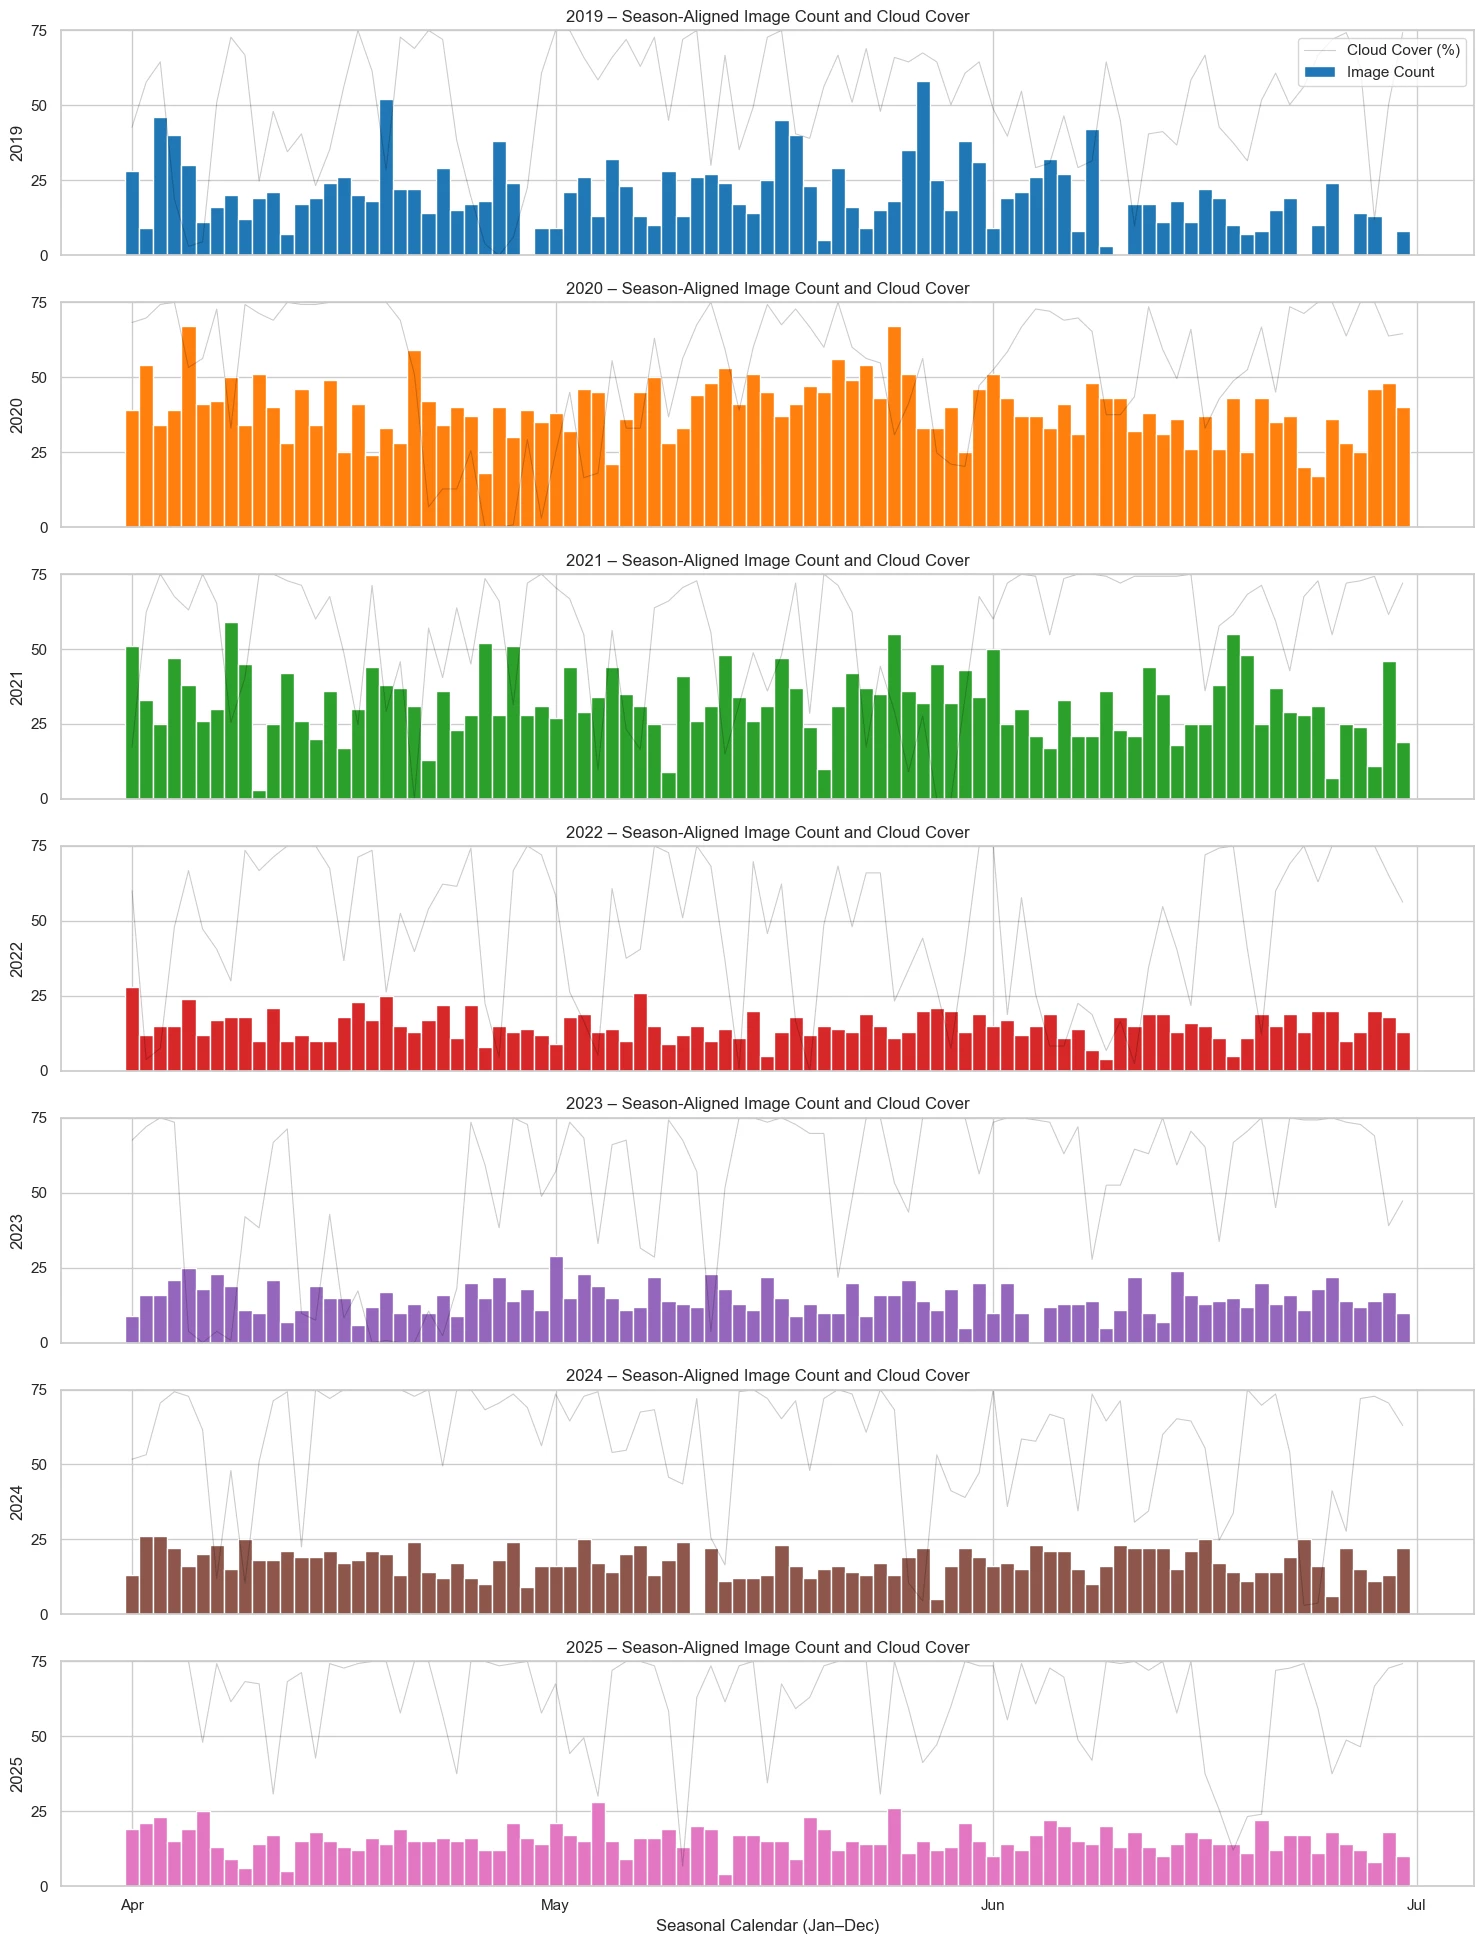
I am working on a project based in Alaska, and put together a script using the API to see how many image-days per month are available in my study region. However, I noticed a really weird trend in 2022 and beyond, where the average daily images drops by almost 50%. What is going on here? I have attached a graph showing data availability with a Planet cloud threshold of 25% image cloud cover (ignore the grey trend line behind, that is unrelated to planet data.)
What is going on here with the drop in data coverage?