
Hello there
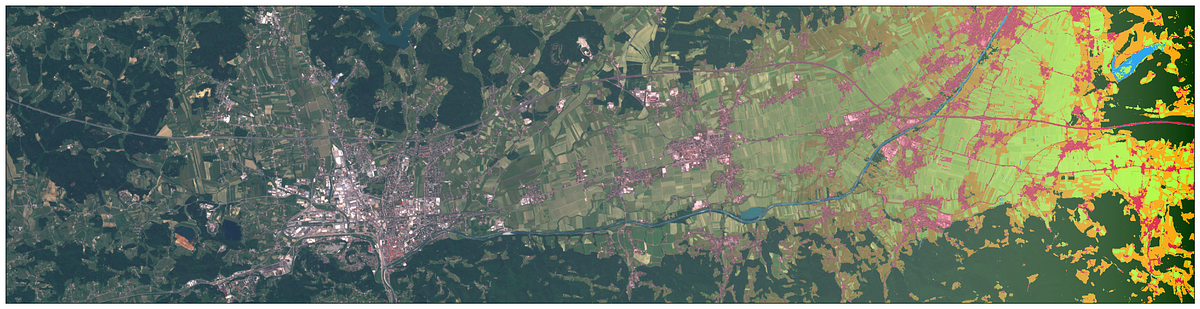
Is it possible to extract the vegetation area from the agriculture or any layers
the idea is to extract the vector data and calculate the area
or if there is any suggestion it will be appreciated
Thanks

Please have a look at:

I hope you will find what you are looking for.


thanks for your replay
I have gone through the info you provided but wasn’t able to find a lear way to extract vector data from those different images what we are looking for is to get is to measure the green area within the city.
looking forwarded to hear from you


You have to take into account, that satellites are not measuring “vegetation areas” or “green areas in the city”. Satellites measure different spectral wavelengths. You then have to use a combination of remote sensing knowledge and/or machine learning to extract information you are looking for from the imagery itself.
Find two more links below, but do note that the path to the result will be a longer one.

Vector data output from the API, after you have configured the Custom script to have some zoning.

3940225e572d0749176f6b5f47759d3d1fc0b648.pngsentinel-hub.com
d3714e73b38a87afa3c31502a6696052a7395163.png

Output Formats

Requests provide output as image or in vector, and the Sentinel-2 WMS/WMTS/WCS services can generate these outputs in different formats.

Machine learning approach to search for specific land cover:

360db83263e79cba7951e7ba15aa4495131aa0f1.pngMedium – 30 Dec 20
8bd16f71a837c2d5e59579e399daa3628607f1a4.png

Land Cover Classification with eo-learn: Part 1

Mastering Satellite Image Data in an Open-Source Python Environment

Reading time: 8 min read


To get the ratio of green area in the city you don’t really need to extract vectors. As I assume you have vector boundary for your city of choice, you could then retrieve the NDVI image over that area and just sum the number of pixels above some NDVI threshold (which you can define in a way that it suits your needs).

If you need to get the vectors (e.g. geometries of the green areas), you would then have to vectorise the pixels where the values of the said index are above the given threshold. Similar approach is done with detecting surface areas of waterbodies: https://water.blue-dot-observatory.com/. You can inspect the approach on https://github.com/sentinel-hub/water-observatory-backend/, or go through the example in eo-learn https://eo-learn.readthedocs.io/en/latest/examples/water-monitor/WaterMonitorWorkflow.html.