I am attempting to use Ulyssys Water Quality Viewer (UWQV) to create a timeseries using the Statistical Info/Feature Info Service Chart function on EO Browser, and I am having a hard time understanding the output.
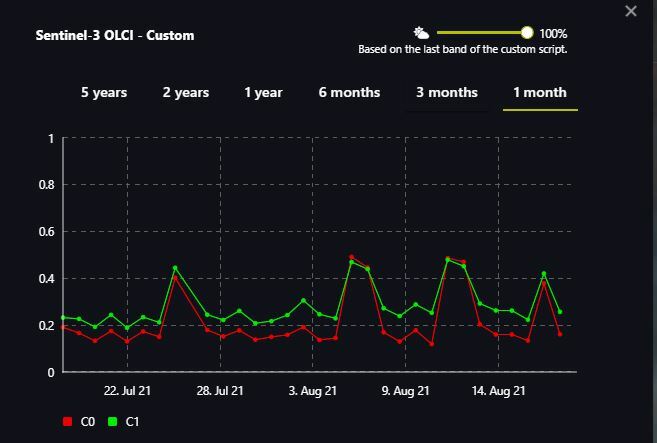
I have used UWQV as a custom script (available through the link above) to view chlorophyll and sediment with Sentinel-3 data. The script creates the images I am looking for on the map, and I am able to use the Statistical Info function to create a timeseries. The graph shows two lines labelled “C0” and “C1”, but I cannot tell what these values represent. Looking at this post, it looks like I need to modify the script. Where in the script should I change the values (I want to show rlh and tss)?
Thank you!